Setting Up Email or SMS Alerts When an Agent Job Fails
Catch silent agent failures before they cost you money and customer trust.
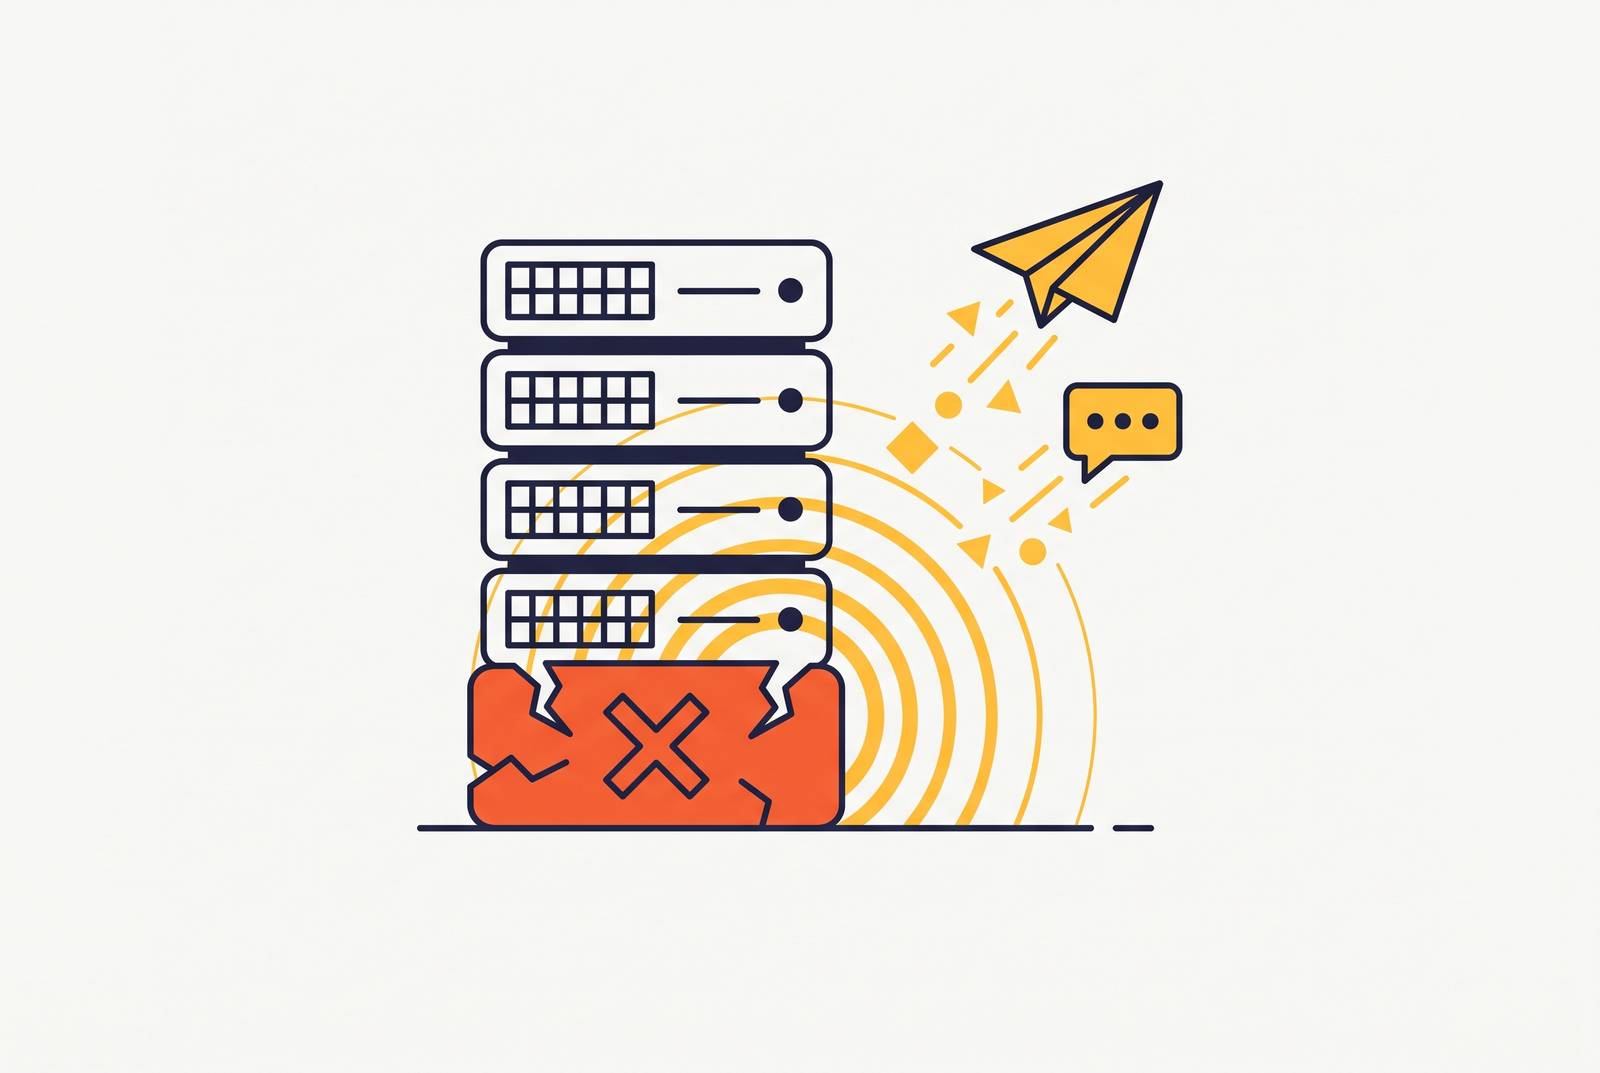
AI agents fail differently than servers do. A server that's down returns an error code, and everyone knows immediately. An agent that's broken often returns HTTP 200 while doing the wrong thing entirely: executing an unauthorized action, inventing a policy that doesn't exist, or looping on bad context until it burns through a token budget. Uptime monitoring tells you the process is alive. It says nothing about whether the output is correct, and that gap is where the real cost hides.
Two cases make the stakes concrete. In February 2024, the British Columbia Civil Resolution Tribunal found Air Canada liable after its chatbot invented a bereavement-fare policy that didn't exist. The airline argued the bot was a separate legal entity and lost that argument outright. In April 2025, Cursor's support agent fabricated a policy about multi-device logins, and subscriptions started canceling before anyone traced the problem back to what the cofounder later described as an incorrect response from a front-line AI support bot. Per PwC's 2025 Agent Survey, 79% of organizations have already adopted AI agents, yet most still can't trace a failure through a multi-step workflow or measure output quality in any systematic way. Deployment turned out to be the easy part. Seeing what the agent actually did in production is the part nobody solved yet, and closing that gap is what this piece is about.
What an agent job failure actually looks like in practice
Agent failures don't come in one flavor. They split into distinct categories, each with its own signature and its own urgency, and treating them as one undifferentiated "something broke" bucket is how teams end up either drowning in noise or missing the failure that actually mattered.
Hard failures are the easy ones. A tool call throws an exception, a sandbox times out, an API key gets rejected, a dependency goes unreachable. These show up in logs the same way any software crash does.
Soft failures are harder to catch because nothing crashes. The agent finishes the job and reports success, but it used the wrong tool, skipped a step it was supposed to take, looped in place without making progress, or produced output that passes a format check while being wrong in substance. Sometimes it hallucinates a fact the retrieval pipeline never actually grounded. None of that trips an error code.
Multi-agent handoffs add a third failure mode. One agent produces malformed output, the next agent inherits it as working memory, and the corruption spreads through the chain invisibly, since each individual step still "succeeds" on its own terms.
Then there's drift. Runaway token usage, a sudden spike in API spend, and a tool's success rate quietly dropping without ever throwing an outright error all count. Vectara's hallucination research puts ungrounded hallucination rates anywhere from 1% to nearly 30% depending on the model and task, and that spread alone is why a single yes/no error check isn't enough. Threshold-based alerting matters precisely because the failure lives on a scale, not a binary. For alerting design, the question that actually matters is simpler than the taxonomy suggests: which of these needs a human right now, and which can sit in a queue until morning?
Which signals actually warrant an alert, and which create noise
Not every anomaly deserves to wake someone up. The hard part of alert design isn't catching everything, it's triage: deciding what's worth interrupting a person for, and what just needs a record somewhere.
Immediate notification belongs to a short list. A hard task failure that exits with an error or exception, a breached timeout at the tool-call, task-loop, or sandbox-lifetime level, an evaluator score that drops below threshold, a cost spike where token spend or API calls blow past the expected range in a single run, a tool error rate spike across a connected service like GitHub, Gmail, or Slack, or a human review queue that's backed up past its SLA.
Everything else goes in a daily digest instead of a page: minor latency bumps within normal range, a single tool call that failed once and succeeded on retry, low-severity quality flags on tasks that don't carry much weight.
Behavior drift deserves its own category, separate from outright failure. Loops, responses that get unusually short or long, a tool success rate that starts sliding, these tend to show up before the hard failure does, so catching them early is how a team gets ahead of a regression instead of reacting to it after the fact. None of this works without an audit trail underneath it: every network request, shell command, and file write logged immutably, so an alert points to a traceable event instead of forcing someone to reconstruct what happened from memory. Decide what deserves attention first. The channel it travels through is a separate decision, and that's what the rest of this piece covers.
Email alerts: the baseline channel and when to rely on it
Email is the right default for anything asynchronous: failure notifications that don't need a same-minute response, audit trails, low-severity anomalies. It's also the fallback of last resort. If the Slack webhook goes down or the SMS provider has an outage, email needs to still fire, because it's the one channel that doesn't depend on a third-party integration staying healthy.
A few ways to wire it up. An SMTP relay through a transactional email provider like SendGrid, Postmark, or AWS SES is the standard path for a self-managed setup. Google Cloud Monitoring supports native notification channels, which is the simpler route for anything already hosted on that cloud platform. Composio's Gmail integration lets the agent send a structured failure email directly through a GMAIL_SEND_EMAIL call, which matters when the notification logic needs to live inside the agent's own workflow rather than bolted on from outside.
A failure email worth reading contains the agent name and the user or sandbox ID, the task or job identifier, the failure type (hard error, timeout, evaluator flag), a timestamp with how long the job ran before it failed, and a link straight to the trace or audit log. Skip any of that and whoever reads the email has to go dig for context before they can even start fixing anything.
Email alone isn't enough for anything running in production, though. It assumes someone's inbox is open and being watched, and for a mission-critical agent that assumption doesn't hold at 2 a.m.
SMS alerts: configuring the channel you can't ignore
SMS earns its place when an agent is mission-critical, when a failure has consequences that compound by the minute, or when the person on call isn't likely to see a Slack ping or an email in time to matter. It doesn't need an app installed and it reaches almost any phone, which makes it the most reliable interrupt available for anything happening off-hours.
The setup itself is simple. Phone numbers need E.164 formatting (+1XXXXXXXXXX), messages route through a provider like Twilio or similar services, which plug into most orchestration layers without much friction. Google Cloud Monitoring treats SMS as a native notification channel right alongside email, Slack, and PagerDuty, so it's not a separate system to bolt on.
Keep the message itself short: agent ID, failure type, severity, a short link. SMS has no patience for a verbose payload, and trying to cram in trace details just means the message gets cut off. SMS also shouldn't fire on every single alert that comes through. A sane escalation pattern is Slack first, immediately, with SMS only kicking in if the failure keeps going past a set threshold, say 15 minutes of continued failure. That keeps the interrupt reserved for things that actually need it.
Volume is worth watching too. In a high-traffic setup running many agents at once, SMS costs add up fast, so rate-limiting by severity and deduplicating before sending is less an optimization and more a requirement.
Slack, webhooks, and where most teams actually route their alerts
Slack ends up as the first stop for most agent failure alerts, mostly because it's where the team is already looking. Routing an alert there is lower friction than email for anything that needs a fast response.
Routing should follow severity, not go to one channel by default. Routing should be tiered by severity: routine failures to a shared team channel, and higher-stakes flags like security or compliance issues to channels that ensure a paper trail and an acknowledgment rather than a scroll-past message in a busy channel. Cost anomalies get their own dedicated channel, separate from general ops, so a spend spike doesn't get buried under routine chatter.
On the integration side, a webhook URL is the simplest option: it posts a JSON payload to a channel with no extra authentication layer to manage. The official Slack API with a centralized bot token is the more durable model, the same pattern PagerDuty's current Slack integration uses, and it's more durable than per-user authorization approaches. The same webhook pattern extends past Slack, too. Microsoft Teams, Discord, and internal custom services all accept a JSON payload with alert details, so switching destinations is mostly a matter of changing the endpoint. Composio connects Slack as one of its 500-plus pre-authenticated app integrations, which means an agent can post a structured failure notice as a tool call inside its own workflow, keeping the notification logic in the agent harness instead of scattered across external monitoring config.
PagerDuty and escalation policies for agents that can't wait
Not every agent needs an on-call rotation behind it. If this agent fails and nobody notices for 30 minutes, what happens? If the answer is "not much," PagerDuty is overkill. If the answer involves money moving, a customer-facing action with no human checkpoint, or a multi-agent chain where one failure cascades into the next, it's warranted.
Prometheus Alertmanager is worth having as a routing layer in front of PagerDuty rather than sending everything straight through. It handles deduplication, grouping, silencing, so when a shared dependency goes down and ten agents error at once, that doesn't turn into ten separate pages. A common production pattern: critical alerts route to both PagerDuty and Slack, warnings go to email only.
Inside PagerDuty, a three-level escalation policy covers most cases. Level one sends a Slack notification to whoever's on call. Level two escalates to SMS if it goes unacknowledged after 15 minutes. Level three bumps it to a secondary on-call engineer or the engineering lead. Worth watching going into 2026 is AI-enriched incident routing: intercepting the PagerDuty alert, running it through an agent that analyzes the incident and suggests next steps, then routing that enriched version into the right Slack channel based on severity. That cuts down the guesswork for whoever picks up the page, since they're not starting cold.
Splunk On-Call is a reasonable alternative for teams already living in the Splunk ecosystem, particularly since Galileo's acquisition by Cisco folded it into Splunk's AI Agent Monitoring, extending what was already there.
Wiring alerts into a per-user agent setup (the sandboxing complication)
Alerting for a single-tenant agent is straightforward: one team, one inbox, one Slack channel. It gets more complicated the moment each customer runs their own isolated sandbox, because a failure now needs to reach the right owner, not just land in a generic ops channel that nobody specific is watching.
Each sandbox needs to emit its own audit log, tied to that user or sandbox ID: every network request, every shell command, every file write. Alerts need to carry that sandbox ID along with them, so whoever reads the alert knows immediately which customer's agent broke, not just that something somewhere did. Timeout limits should be set at multiple levels covering individual tool calls, task loops, and sandbox lifetimes, with a violation at any of those levels triggering an alert scoped specifically to that sandbox.
White-label operators run into an extra wrinkle: who actually gets the alert? The operator's own ops team, the end customer, or both? That routing decision belongs in onboarding configuration, decided upfront, not something patched in after the first incident makes it obvious it was missing.
Spend caps per instance work as a companion control here. They stop a runaway agent from burning through a customer's allocation before a human even has a chance to step in, which buys the alert time to actually reach someone before the damage is done. The practical approach is to treat every sandbox as its own alerting unit, tagged by user ID, instance ID, and tier, with failures routed up the chain from customer to operator to platform based on severity and how fast a response is actually needed.
Monitoring platforms that surface what triggered the alert
An alert tells a team that something broke. It doesn't tell them why, and without that second piece, responding to the alert means manually reconstructing a multi-step decision chain from raw logs, which is slow and error-prone even for an experienced engineer.
What agent-specific monitoring adds on top of standard application monitoring is visibility into the reasoning itself: which tools got called, what context got retrieved, how the agent reasoned at each step, and exactly where the chain diverged from what was expected. That's the layer standard uptime and APM tools were never built to capture.
A few platforms stand out in this space heading into 2026. Maxim AI covers the full lifecycle, experimentation, simulation, evaluation, and production monitoring, in one platform, with a three-level trace hierarchy of sessions, traces, and spans, and alerts routed through PagerDuty and Slack on latency, cost, token usage, error rates, and evaluator scores. It holds SOC 2 Type 2 and ISO 27001 certification, with customers including Clinc, Atomicwork, and Mindtickle.
LangSmith is strongest inside the LangChain and LangGraph ecosystem, though it works with other LLM frameworks too, and it has processed over 15 billion traces across more than 300 enterprise customers. Its platform surfaces usage patterns and recurring failure modes over time, and the platform includes tooling aimed at simplifying trace inspection so engineers spend less time reading raw logs line by line.
Arize, along with its open-source core Phoenix, is the other name worth knowing. Arize raised a $70 million Series C in February 2025 and counts Uber and Booking among its customers. Phoenix itself runs under the Elastic License 2.0, sits at roughly 10,000 stars on GitHub, and is built OpenTelemetry-native, which means it can run fully self-hosted for teams that need to keep trace data inside their own infrastructure.