Reading an Agent Activity Log to Diagnose a Silent Failure
Learn which trace patterns reveal why agents fail silently in production.

An agent fails silently when it hands back a normal-looking response and a clean 200 status while the process underneath produced the wrong answer. No crash, no timeout, no alert. Traditional monitoring was built to catch a server going down, a request timing out, a process dying. None of that applies here, because the agent didn't break. It made a string of small, wrong decisions that added up to a bad outcome, and the only record of those decisions sits inside an activity log that most teams never learn to read.
That's the real skill gap. Not "does your agent have logging," but "does the person on call know which span to open first, which argument to check, and which pattern in the sequence means the agent is stuck versus drifting versus quietly getting worse." Most teams treat all three the same way, which is the mistake. They need three different reads, and this piece walks through each one, failure mode by failure mode.
The six failure modes that produce no error signal
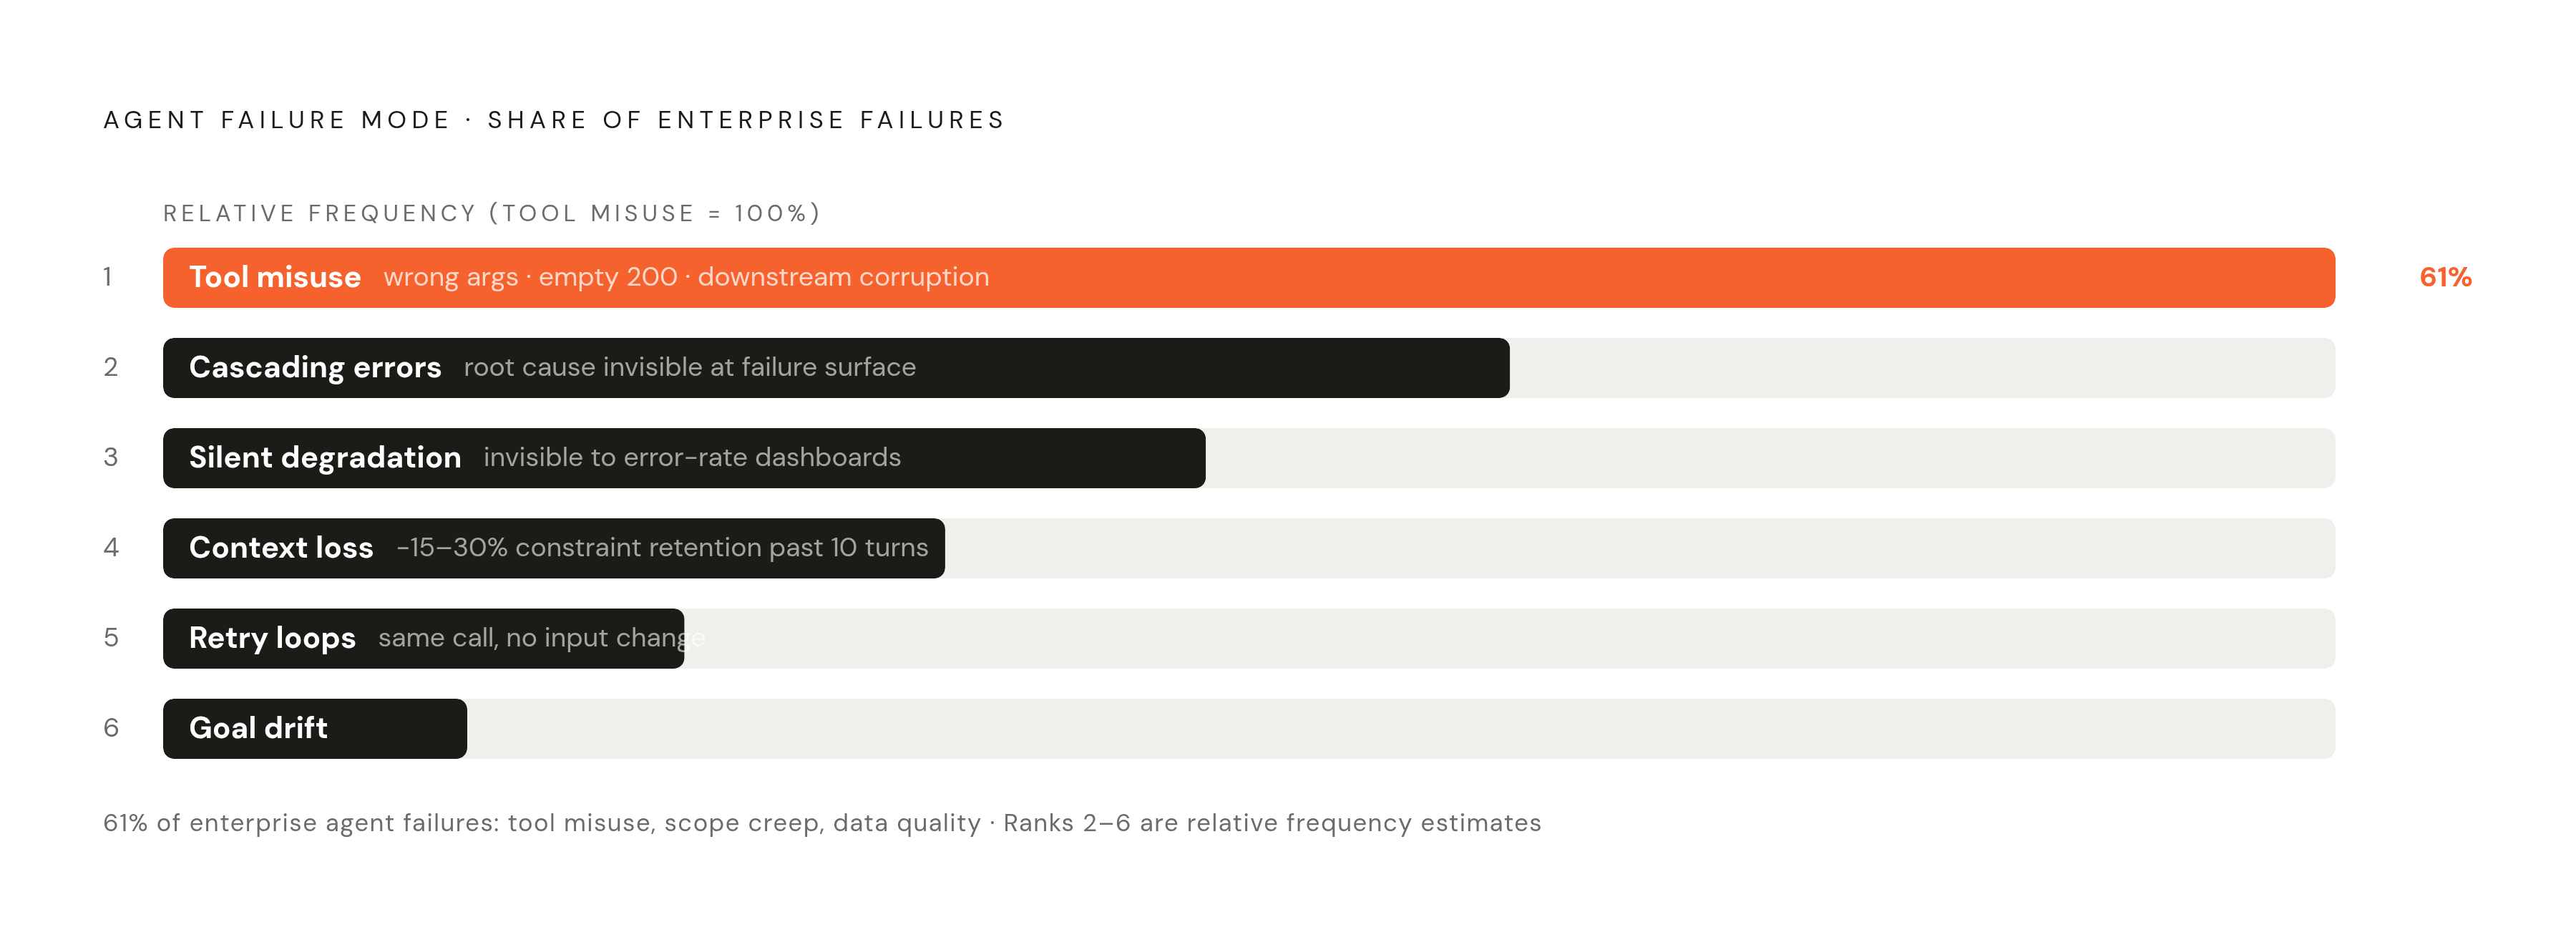
Research from IBM (arXiv:2511.04032), built on a benchmark of 4,275 and 894 labeled trajectories, and separate production observability work from Latitude, land on the same finding: agent failures cluster into six recognizable patterns, and each one leaves a different fingerprint in the trace.
Tool misuse and tool call failures. Wrong arguments, the wrong tool picked for the job, a tool that returns an empty response with a perfectly healthy 200 status, or one bad call that corrupts every step downstream of it. This is the most common category by far. Per data cited by prefactor.tech, scope creep and data quality issues account for 61% of agent failures logged across enterprise deployments. A single malformed argument at step two doesn't just break step two. It breaks everything reading from step two afterward.
Context loss across turns. The agent forgets a constraint or preference set earlier in the conversation. Latitude's research, citing studies of commercial LLM agents, puts context retention accuracy down 15 to 30% in sessions running past 10 turns. Each turn looks fine taken alone. It's only wrong measured against what came before it.
Goal drift. No single step fails, but the agent slowly reinterprets the original ask until, several steps later, it's solving a different problem. A scheduling agent re-weights a conflict at step four, quietly redefines what "avoid Fridays" meant, and by step eight is booking the wrong month.
Retry loops and cycles. The agent calls the same tool again and again without changing its approach, burning tokens and clock time along the way. IBM's taxonomy calls these cycles: the agent re-plans, invokes the same tool or the same downstream agent, and gets the same non-answer back.
Cascading errors in multi-agent systems. One agent hands bad context to another, which then acts on it correctly, just toward the wrong goal. The root cause sits invisible from where the failure surfaces. You only ever see the downstream mess.
Silent quality degradation. Output quality slides gradually. No error codes anywhere, sometimes a step gets skipped, sometimes the agent just drifts from whatever validated behavior looked like back in staging. Error-rate dashboards can't see any of this. It only shows up when you score outputs over time against a baseline.
A generic log reader, someone scanning for red text and stack traces, misses nearly all six of these. Each failure mode needs its own specific check, and none of them share a fix.
What a useful activity log actually contains
Most logging setups capture what went in and what came out. The reasoning that happened between those two points, where Latitude AI estimates roughly 80% of agent bugs actually live, gets thrown away.
A trace built for real diagnosis needs four things. End-to-end traces with correlation IDs come first: a parent-child hierarchy tying every model call, every retrieval, every tool invocation in a session together, so you can walk the whole thing as one object instead of piecing together fragments. Prompt and response capture at every step matters too, not just the final answer the user saw.
Token count and cost per step deserves its own line, because cost drift is a behavioral signal in its own right. A jump in token spend without a matching jump in output quality usually means the agent started looping, or over-explaining to itself. And tool call outcomes need the exact arguments passed, the return value, and whether the agent noticed if that return value came back empty or cut off.
There's a real difference between logging the full chain-of-thought and logging decision boundaries. Storing every intermediate thought at scale gets expensive fast, and most of it is noise. What actually matters is the moment the agent weighed options and picked one: the tool it chose, why it chose that tool, any confidence score attached to the choice. That's the layer that explains the path taken, not just the sequence of steps taken along it.
Without it, a trace shows you that the agent spent time and tokens. It never shows you why it went the direction it went.
Teams that have added nothing more elaborate than append-only JSONL files plus evals run against the production model path report that the logs surface real problems on day one. Per sherlocks.ai, incidents without reasoning traces took an average 4.2 hours to resolve. That figure is the entire argument for building the log this way, and it's not a close call.
Reading the span sequence to locate where a workflow went wrong
A trace is a structured record with depth, not a flat list. It's a tree: a root span with children branching off it. Reading it starts at the top, not by scrolling through entries in the order they landed.
Run the sequence-level checks before opening a single span in depth. Does the actual span sequence match what this agent type should be doing? A billing support agent, for instance, should retrieve the account, check policy, respond, and escalate only if needed. Deviation from that shape is the first sign something's off. Are expected spans missing? Step omission tends to show up here before it shows up anywhere else. Are spans repeating with no change in input or context? That's the signature of a retry loop. Does the total step count blow past what's reasonable for this kind of task? Too many steps points to a stuck loop, or drift.
IBM's taxonomy defines drift specifically as the agent choosing tools, or handing off to other agents, that don't fit the actual query, something you catch by comparing the real tool sequence against the expected one. In IBM's benchmark testing, anomaly detection models run directly on trajectory sequences, XGBoost in a supervised setup and SVDD in a semi-supervised one, hit accuracy up to 98% and 96% respectively across the two labeled datasets. The sequence shape alone carries most of the signal.
Rule out sequence-level anomalies before digging into individual spans. It's faster, and it tells you exactly which step range deserves a closer look, so you're not reading the whole trace end to end when you don't have to.
Interrogating individual spans: arguments, tool selection, and return values
Once the suspect range is narrowed down, open each span in it and check four things, in this order.
First, the arguments passed to the tool: right types, required fields present, values pulled from the correct prior step rather than made up on the spot. Second, the tool selected: is it actually the right one for the task, or a plausible neighbor that produces a response that looks fine but answers the wrong question? Third, the return value: did the tool come back with a 200 and an empty or truncated payload, and did the agent's next move treat that empty result as a success? Fourth, whether the agent even noticed a tool error, or just kept going. Once it proceeds past a silent failure without flagging it, every span after that is built on a broken foundation.
That's the chained corruption pattern in practice: one bad argument at step N poisons everything from N+1 to the end, so the wrong output you actually see sits several spans downstream from the real cause. Per prefactor.tech's observability framework, each meaningful span should carry a quality score of its own, not just a timestamp, and for a tool call that score checks whether the action taken matches the intent stated and stays inside its authorized scope.
Two incidents make the pattern concrete. The Replit incident from July 2025, and the Cursor and Claude Opus 4.6 incident from April 2026, where a credential mismatch during a staging run led the agent to delete an entire production database along with every volume-level backup, in nine seconds, triggering a 30-hour operational crisis. In both cases, the span carrying the wrong scope assumption showed up in the trace well before the destructive action happened. Neither incident registered as an infrastructure event until after the damage was already done. The evidence sat in the log the entire time, readable, just not read.
Detecting context loss and goal drift across a multi-turn session
Context loss and goal drift share one trait: no individual span breaks. The failure lives in the relationship between spans, not inside any single one of them.
For context loss, find the span where an early constraint got set, something like "avoid Friday" or "don't touch production data." Trace forward from there and check whether that constraint is still sitting in the prompt context by the time later spans run. Given that context retention drops 15 to 30% past the 10-turn mark, long sessions call for deliberate constraint tracking rather than an assumption that it holds. For memory-augmented agents, check the retrieval spans specifically: did the relevant memory actually get pulled back in, or did it get pushed out by whatever was more recent?
Goal drift takes a different read. It's emergent: no single step is wrong, but small reasoning shifts stack on top of each other until the outcome no longer serves what the user actually asked for. Read the objective stated in the root span, then read how the agent frames its own task at the midpoint, and again near the end. A gap between those two framings is goal drift showing itself. A study on arXiv (2606.08162), running over 40,000 controlled trials and drawing on more than 100,000 production interactions, frames this as system entropy: a measurable loss in output consistency, task accuracy, and cross-session coherence that climbs steadily as interaction rounds pile up.
None of this reads without full prompt capture at every step. Skip the mid-session snapshots and both context loss and goal drift go invisible, because there's nothing left to compare against. The fixes diverge too. Context loss responds to structural changes: better retrieval, compaction, recall checkpoints. Goal drift needs an evaluator holding the entire conversation history in view, not just the one span where things finally look wrong.
Clustering failures across sessions rather than reading each trace individually
Everything above is forensic work. It finds the cause after somebody already reported a bad outcome. Fine at small scale. Useless at production scale.
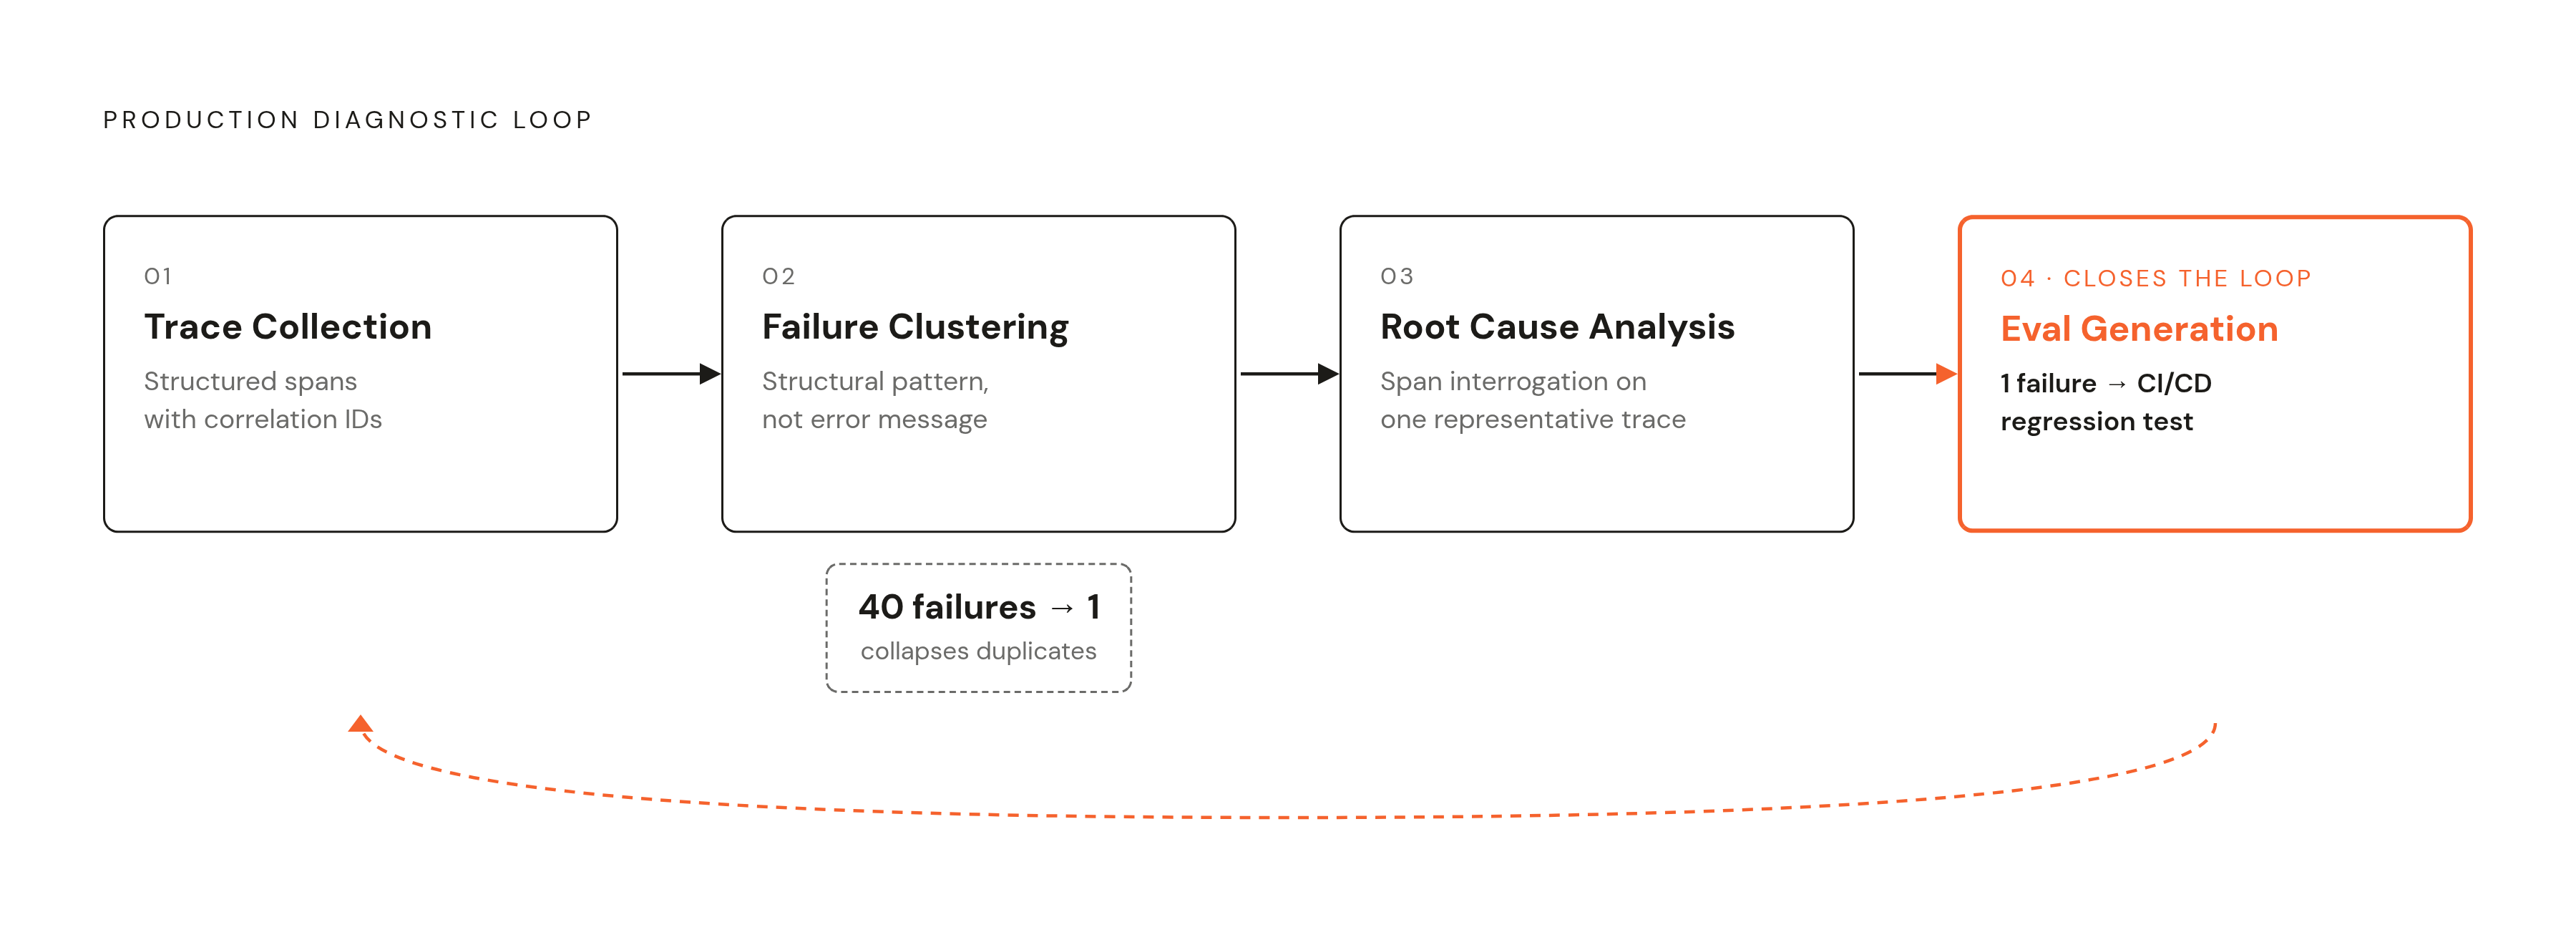
Picture 40 sessions failing for the identical underlying reason. Without clustering, that's 40 separate log entries landing on an on-call engineer's desk, looking like 40 unrelated problems. Clustering gives back one line instead: tool call retry loop, context window overflow, 38 occurrences, here's a representative trace. Noise turns into signal, and the engineer reads one trace instead of forty.
The loop that supports this runs in four steps. Trace collection first, the structured spans with correlation IDs already covered above. Failure clustering next, grouping traces by shared structural pattern rather than by whatever error message happens to sit on top. Root cause analysis third, reading one representative trace using the span-interrogation method from the section before this one. Eval generation last, turning that single production failure into a regression test that runs against every release going forward. Per prefactor.tech, leading engineering teams have built evaluation-integrated CI/CD pipelines around exactly this loop, converting real production failures into tests that guard against the same thing happening twice.
Behavioral schema validation extends this to the population level: compare every run's activity against the expected step sequence for its agent type, and schema violations flag step omission before any user actually feels the consequence. It also matters to keep operational failures out of the same alert stream as behavioral drift. A tool timeout, a rate limit, a missing credential, those go to incident response. Behavioral drift goes to the evaluation pipeline, where the output is a regression test and a policy review, not a page at 2 a.m.
Fewer than 1 in 10 enterprise applications reach full observability as of 2026, and for agentic systems specifically, the number runs lower still. Most teams are still stuck reading one trace at a time, and that's the actual bottleneck, not a lack of logging tools.
What the log cannot tell you without a behavioral baseline
Reading one trace in isolation can't tell you whether the agent made an unusual but correct call, or actually drifted off course. You need something to measure it against, full stop.
Silent quality degradation depends on a baseline more than any other failure mode, because the individual spans all look reasonable taken one at a time. Quality falls gradually, no error codes anywhere, and only the trend across many runs gives the problem away. There's also a well-known gap between offline and online evaluation: agents that score well in staging still fail in production, because real-world input distributions shift, real users don't behave like synthetic test cases, and the underlying model itself gets updated out from under the system running on top of it.
The Entropy Principle study cited above found that failures happened with no external trigger at all. No injected fault, no adversarial input, no resource running out. The disorder built up on its own, internally, across the controlled trials. A baseline, then, can't be a one-time setup checked off before launch. It has to run continuously.
Building one takes a validated stretch of operation to establish what normal step sequences, normal tool arguments, and normal quality score distributions actually look like for this specific agent. It takes time-series scoring, so a deviation from that baseline shows up as a measurable trend rather than a one-off flagged anomaly. And it takes continuous quality evaluation with recall checkpoints built in, not a single gate the agent passes through once before deployment and never sees again.
Sources
- Detecting AI agent failure modes in production: A framework for observability-driven diagnosis
- Detecting Silent Failures in Multi-Agentic AI Trajectories
- Silent AI Agent Failures Are the Production Risk No Dashboard Catches | by Decoding AI by Nueravi | Towards AI
- When Good Traces Turn Silent: Detecting Quality Collapse in Agent Production Deployments
- Silent Failure in LLM Agent Systems: The Entropy Principle and the Inevitable Disorder of Autonomous Agents
- Why AI Agents Fail in Production: The Agent Failure Stack Explained