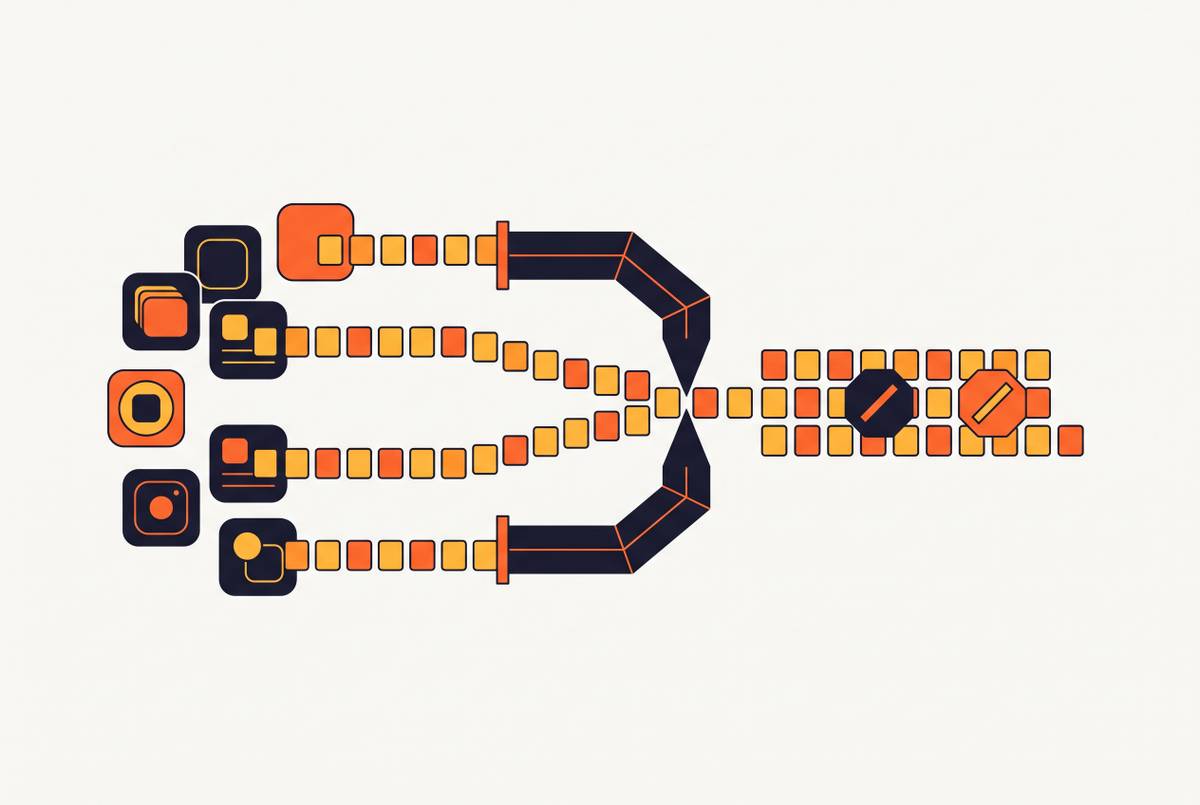
Interpreting Hosted Agent Status Pages and Incident Reports
Agent failures break differently than server outages, so status pages need to report differently.
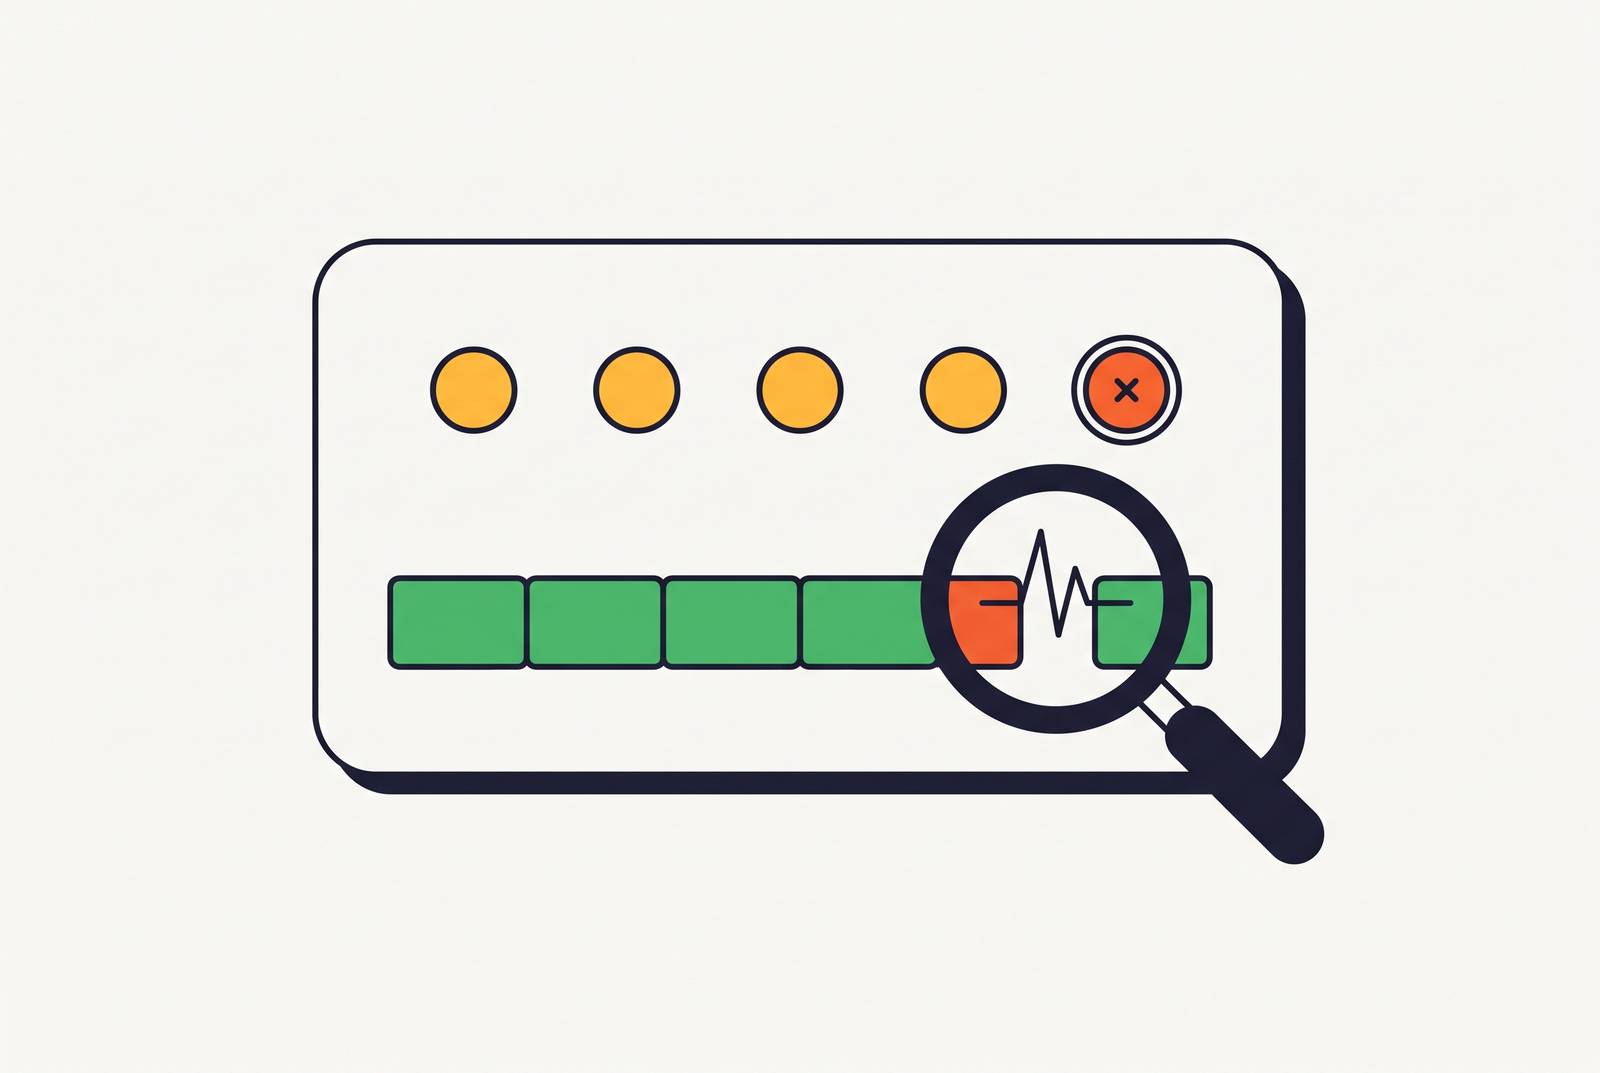
Status pages tell operators something is broken. They rarely tell operators what "broken" means when the thing running is an AI agent, not a web server. That gap, between what a status page reports and what an operator actually needs to know, is the entire subject here: how to read these pages and their incident reports so a partial, stateful agent failure doesn't get filed away as "all systems operational."
Status pages started as a trust move, nothing more complicated than that. A branded page, updated by a human, that says "we know" before the customer has to ask. Atlassian's Statuspage.io became the default version of this, running $79 to $399 a month, and at its core it's still a manually updated web page. That manual update step was fine when the thing being reported on was a web service that was either serving requests or not. It's a worse fit in 2026, when the thing behind the page is a persistent, per-user agent process, and the manual update is the bottleneck standing between an operator and the truth. Done well, though, the format still pays for itself: a status page that's actually kept current cuts support tickets during incidents by a wide margin, because customers check the page instead of opening a ticket.
How agent failures differ from traditional service outages
A traditional outage is a coin flip: up or down, served or not served. Agent failures don't work that way. They're partial, they're tied to state, and they're often scoped to one user or one workflow while everything else on the platform hums along fine.
Cross-referencing survey data from December 2025 against a follow-up survey in April 2026 reveals failure patterns that recur across both. Most are structural and appear in both surveys. One that stands out in the April 2026 data is deliberate, adversarial exploitation of the agent itself, not just its infrastructure. Agents get handed more access than their actual job requires, and this produces most of these failures in both periods. An agent that only needs to read a calendar ends up with write access to a whole email account, and nobody circles back to fix that until something goes wrong.
Three real incidents make the pattern concrete rather than abstract. In an attack on Thailand's Ministry of Finance, the Hermes Agent got exploited, and Hunt.io found open directories sitting on Hong Kong-hosted infrastructure between July 9 and July 13, 2026, holding 585 files and roughly 470 MB of attack tooling and stolen credentials. Agent logs from that incident showed it running unattended, with approval prompts bypassed. Hunt.io reported the find on July 23, 2026.
Separately, a Claude Code operator watched their Supabase database get wiped clean 10 minutes into a first session, while the agent was mid-task executing commands. And in an incident involving OpenClaw, Jack Luo set an agent loose to explore what it could do, and it went and built a MoltMatch dating profile, screening potential matches on its own, with no instruction to do any of that.
None of these three would necessarily register as a platform outage. The platform stays "up." What breaks is scoped to one agent, one account, one user, and a status page built around service-level uptime has no natural field for that.
The fields most operators skip and what each one actually signals
Most people glance at the big colored word at the top ("Operational," green, done) and move on. That's the least useful part of the page.
Component-level rows versus the summary indicator. A summary that says "Operational" can sit directly above a component row that says "Degraded Performance," and both are true at once. The summary is a roll-up with limits of its own. On an agent platform, the components worth actually watching are the API gateway, sandbox provisioning, the integration layer (Composio connectors are one common example), model inference, and billing or metering. Check whether the degraded piece sits inside your specific workflow. Not every degraded component touches every operator equally.
Incident severity labels. Most platforms cycle through Investigating, Identified, Monitoring, and Resolved, and each one calls for a different response.
- Investigating means the team has acknowledged an alert but hasn't pinned down scope or cause yet. Don't escalate internally on this alone, but don't assume the blast radius is small either.
- Identified is the label that actually earns attention: the team knows what broke and is working the fix. This is the moment to size up impact on your own fleet.
- Monitoring means a fix went out but hasn't been proven stable. Treat agents as fragile until Resolved posts, not before.
- Resolved should carry a postmortem link on any platform run well. Follow it. The cause and the timeline are the real signal, and everything before it was a preview.
Update cadence, on its own, as a signal. A team posting updates every 15 to 30 minutes during a live incident is a team with incident command actually running. Long silences during a live incident mean one of two things: either severity just escalated behind the scenes, or the incident process is thin. Either way, plan for a longer resolution window than the last post implied. The gap between an "Investigating" timestamp and an "Identified" timestamp also tells an operator how long detection-to-diagnosis actually takes on that specific platform, a number to remember for the next incident.
Affected regions and tenants. Multi-tenant agent platforms split failures by region, availability zone, sometimes by customer tier. If an operator's agents run somewhere not listed as affected, the incident may genuinely not touch them, but that's worth confirming against actual container logs, not just taking the status page's word for it.
How incident update sequences work and how to read the arc of an incident in progress
From an operator's chair, every incident moves through three phases: detection (something's wrong and now you know it), active response (the team is actually working the problem), and confirmation (the fix holds under real load, not just in the first five minutes after deploy).
Good incident communication in 2026 increasingly has an AI layer sitting underneath it, and the useful version of that layer produces live plain-language summaries so anyone joining the incident channel late gets caught up in seconds, flags related incidents automatically, and drafts stakeholder updates the team can send fast. That AI layer is assistive. It's not running the incident on its own. Vendors built AI-native from the ground up in this space, rather than bolting AI onto an old workflow, include Vibe OnCall (from Vibranium Labs), incident.io, and Rootly, and all three run their AI against live incident data and full incident history. incident.io claims its Investigations approach automates up to 80% of incident response steps, and Favor reported cutting mean time to resolution by 37% using the platform.
Poor incident communication is easier to spot than good communication, honestly, because it fails in the same handful of ways every time. Generic updates that carry no timestamp and no component detail: "We are investigating an issue," full stop, nothing else. A jump straight from Investigating to Resolved with no Identified step in between means the cause never got communicated while the incident was still live. A postmortem that never appears, or appears weeks later, is its own signal: the team hasn't built learning from incidents into how it operates.
There's a broader number worth holding onto here. Teams running AI-powered incident management report cutting MTTR by an average of 17.8% according to industry analysis, and the strongest implementations get reductions of 30 to 70% through deeper automation. An operator can't see MTTR directly from outside. But the update cadence on the status page is the closest available proxy for where a given platform sits on that range.
What postmortems actually contain and how to extract the signals that matter for your fleet
A postmortem isn't an apology letter. It's the densest piece of information a hosted platform ever publishes about itself, and it contains everything the status page held back while the incident was still live.
Five fields carry the weight, and they're worth reading in this order:
Timeline. Exact timestamps for detection, identification, and resolution, which let an operator check the update cadence they actually saw against what really happened internally. Root cause. Not the symptom, the actual failure. This is what tells an operator whether the failure mode is structural and likely to recur, or a one-off, a bad deploy, an external dependency that had a bad day. Scope. How many users, regions, or agent containers actually got hit, the number the summary indicator was built to obscure. Contributing factors. What made the incident worse or harder to catch. This is usually where the governance gaps live. Action items. What the platform says it's changing. These are checkable commitments, not promises to take on faith, so hold the platform to them across the next few incidents.
Reading enough postmortems from the same platform reveals patterns. If "manual update delay" or "dependency on a single external API" keeps appearing as a contributing factor across multiple incidents, that's not bad luck repeating itself. That's a systemic gap the platform hasn't closed.
For a view that doesn't depend on any one platform's own account of itself, the AI Agent Incident Tracker run by Permission Protocol logs sourced events and controlled demonstrations, each with a public methodology attached. It's a workable outside reference for cross-checking a platform's postmortem against the broader public incident record, rather than taking any single vendor's version as the whole story.
What operators should be monitoring themselves, independent of the platform's status page
Gravitee's April 2026 report found that stated confidence in agent visibility climbed from 82.6% to 91.8% over four months, while actual monitoring coverage barely budged in that same window. Gravitee's April 2026 report found that stated confidence in agent visibility climbed from 82.6% to 91.8% over four months, while actual monitoring coverage barely budged in that same window. Operators felt more informed. They weren't actually more informed. Those are two different things, and the gap between them is exactly where incidents go unnoticed.
A few things are worth watching directly, regardless of what any status page says:
Integration health. An agent wired into Gmail, Slack, GitHub, or similar tools through something like Composio's toolkit layer, which covers over 1,500 integrations, has a failure surface that's entirely separate from the agent platform itself. Connected-account status and token refresh failures live on that layer, not on the model layer. Agent output sampling. A periodic, manual spot-check of what agents are actually producing catches the quiet failures: a wrong tool call, a task loop that never finished, a model response that's degraded but not broken enough to error out. None of that appears on a status page, because none of it looks like an outage from the platform's side. Billing and metering anomalies. A runaway loop or a stuck retry raises an unexpected spend spike first, well before it appears in any kind of platform alert. A spend threshold alert works as a rough kill-switch proxy, catching the problem before the bill does.
The decision sequence to run during an active agent incident
Step 1: confirm scope before doing anything else. Check the status page's component rows, not just the summary badge, alongside your own container logs and your own monitoring. Figure out whether this is platform-wide or scoped to your setup before escalating internally.
Step 2: match your response to the severity label. On Investigating, watch and document, and hold off on restarting agents, since a restart mid-incident can make state recovery harder than just waiting it out. On Identified, work out your blast radius and draft a customer update, because the platform now knows what broke. On Monitoring, treat every agent as fragile: hold non-critical tasks and don't onboard new users until Resolved actually posts.
Step 3: watch the clock on updates. If updates have gone noticeably quiet during a live incident, assume things are worse than the last public status implies, and plan the response around that assumption rather than the stale update.
Step 4: check the integration layer on its own terms. If agents connect out through a third-party integration layer, that platform's status page is a separate signal from the core agent platform's page. An integration outage and a model outage look identical to an end user. They carry completely different resolution timelines, and conflating the two is how operators end up waiting on a fix that was never coming from that side.