Rate Limit Errors From Connected Apps and How to Handle Them
Most agent failures stem from rate limits, not reasoning—here's how to survive them.

Rate limit errors, not bad reasoning, are the main reason AI agents fail in production. Datadog's 2026 State of AI Engineering found that in February 2026, 5% of all LLM call spans came back with errors, and 60% of those failures traced to exceeded rate limits, not hallucinations, not tool misuse. By March, the total error rate had dropped to 2%, which sounds like progress until you notice that rate limit failures alone still added up to nearly 8.4 million in a single month across tracked deployments.
That gap between "error rate went down" and "failures went up in absolute terms" tells you something important: agents are running more, fanning out more, and hitting quota ceilings that were never built to handle this kind of traffic. A survey of 650 enterprise tech leaders found 78% have at least one agent pilot running. Only 14% have scaled one to real organization-wide use. Gartner expects more than 40% of agentic AI projects to get cancelled by the end of 2027, and the reason almost never comes down to what the model can or can't do. It comes down to engineering the system around the model.
Why agents hit rate limits harder than chatbots
A chatbot makes one call and waits for one answer. An agent multiplies. A single user request turns into a planning call, then a loop of tool-selection calls, then the actual execution call, then retries layered on top of any of those, and often a set of sub-agents each running their own version of the same loop. What looks like one action to the user can turn into tens of concurrent model calls behind the scenes.
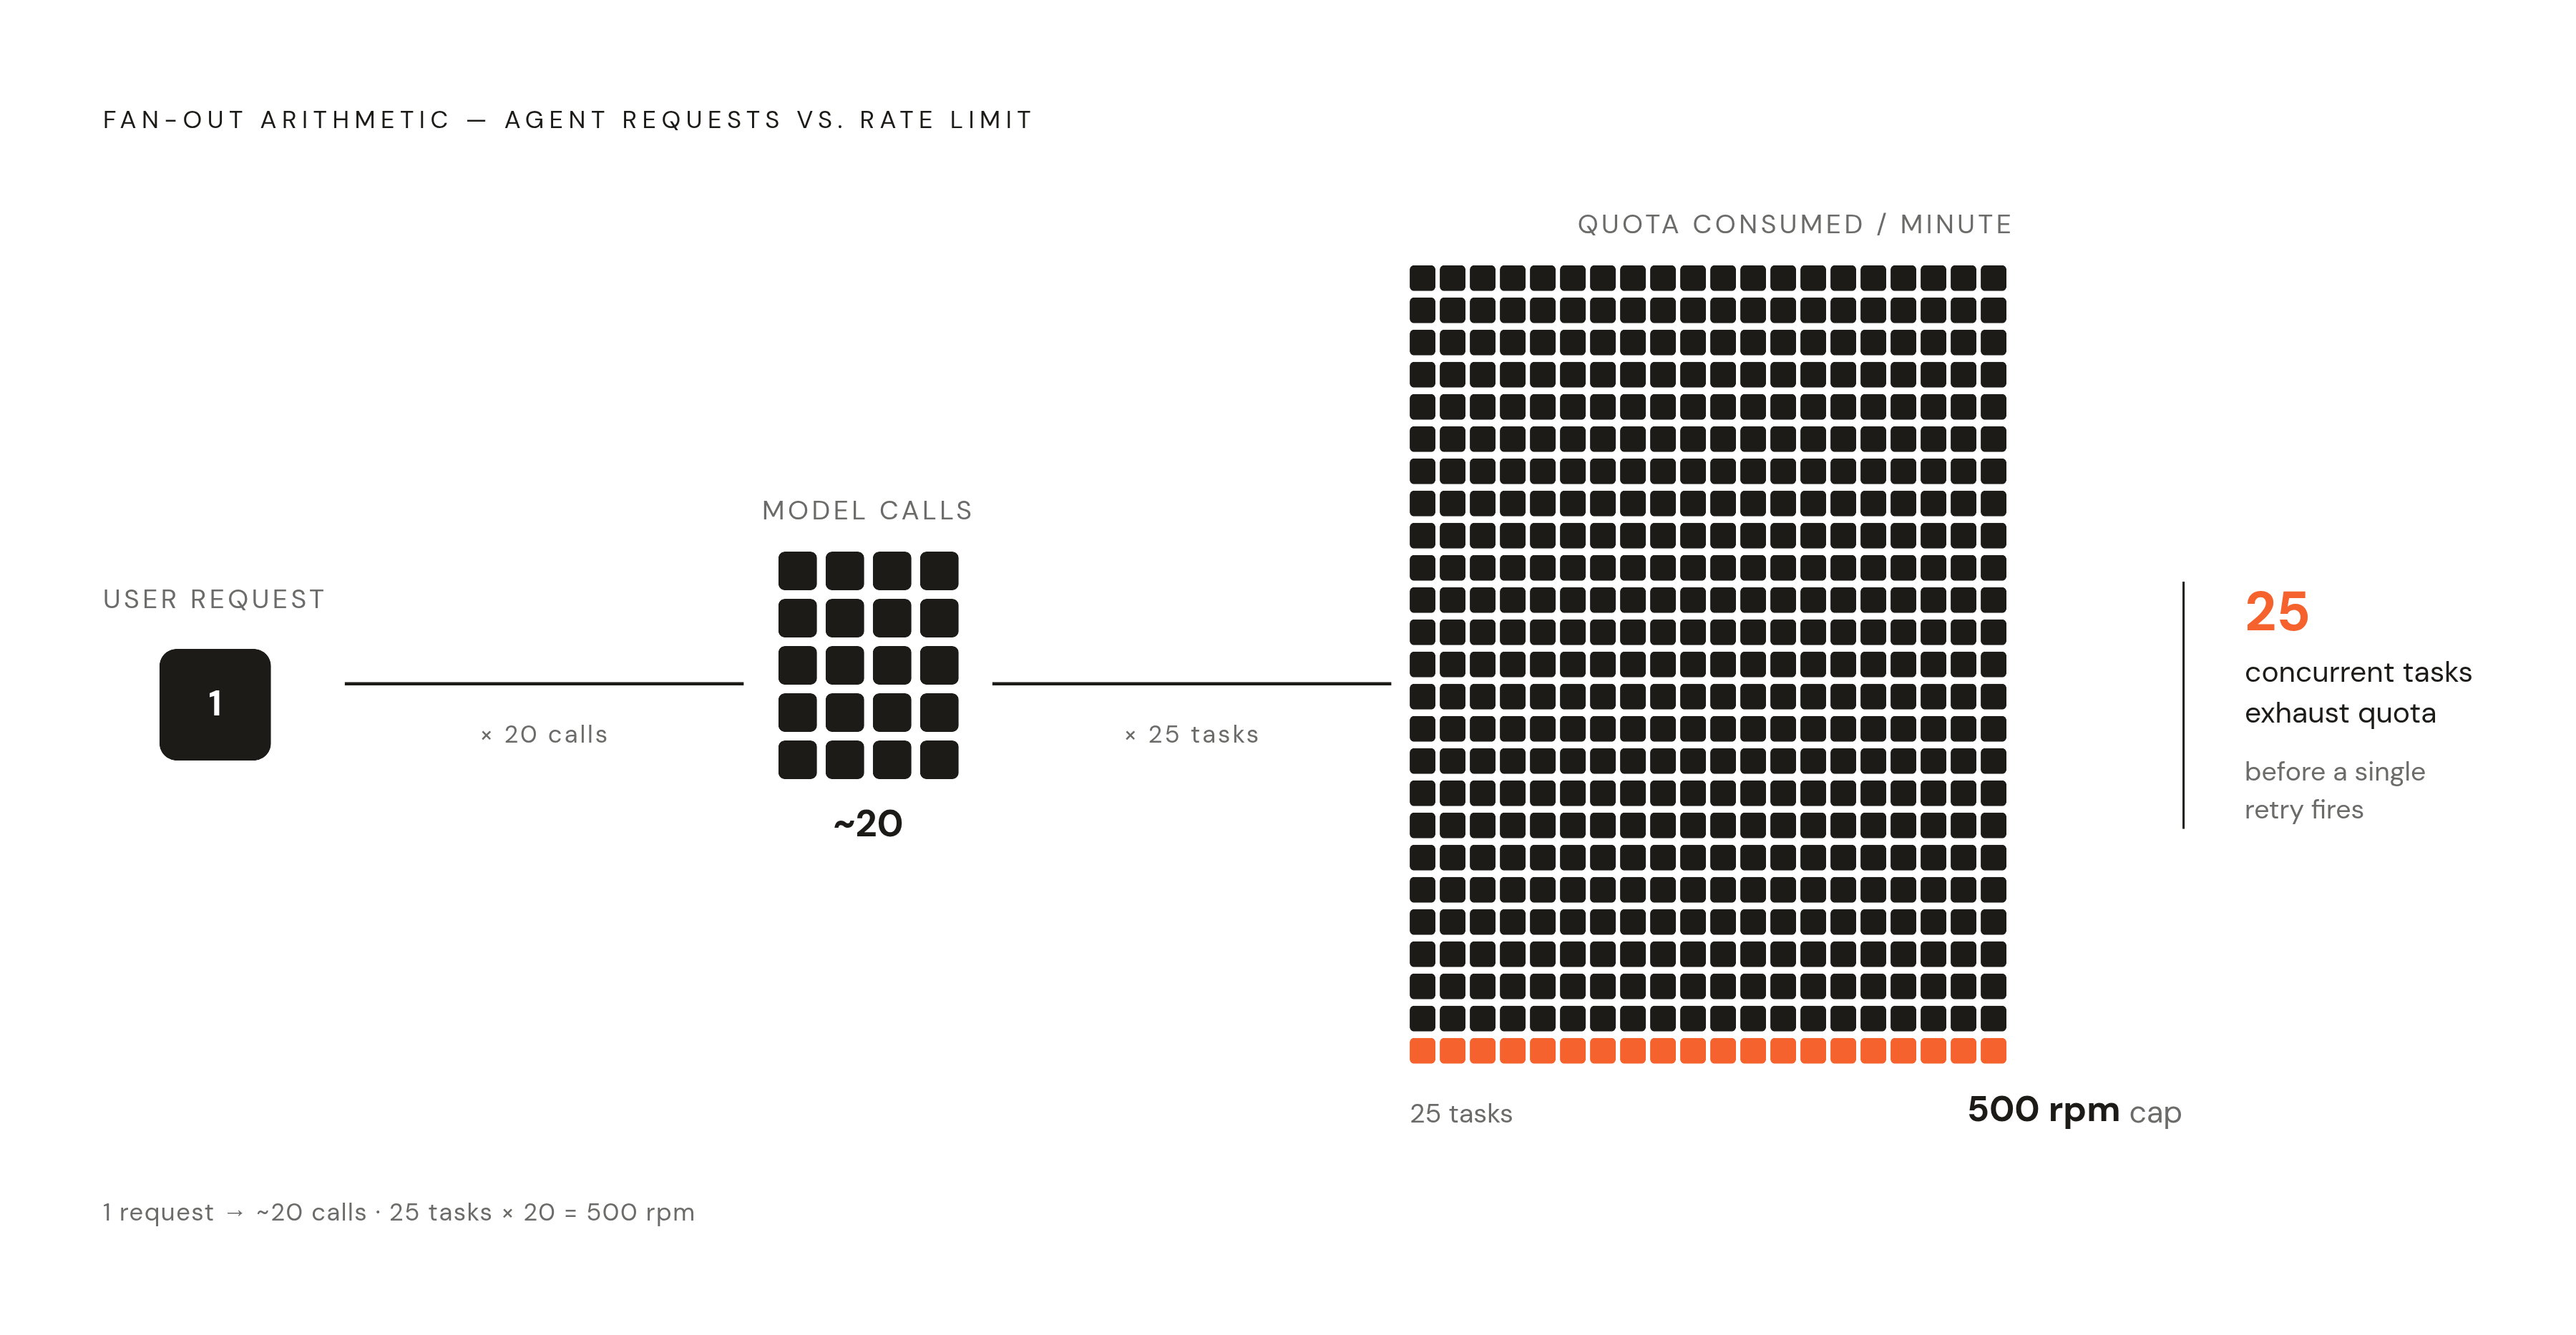
The arithmetic shows the ceiling appears fast. Say a provider caps a team at 500 requests per minute, and each agent task fans out to somewhere around 20 model calls (real deployments range from 10 to 40 depending on how deep the tool chains go). Just 25 concurrent tasks eat the entire quota before a single retry fires. That's before a single retry fires.
And retries make it worse, not better, if they're built naively. A 429 comes back, the code retries right away, and that retry hits the same wall and gets another 429. One rate-limit event turns into a retry storm, and the storm takes the whole task down with it.
There's a trap hiding inside serverless infrastructure specifically. Autoscaling does what it's supposed to: traffic spikes, new instances spin up, compute absorbs the load. But the LLM provider's quota doesn't scale with container count. It stays fixed, unlike the autoscaled infrastructure around it. So the platform built to absorb load ends up amplifying the spike instead, slamming a growing number of workers against a ceiling that never moved.
Classifying rate limit and capacity errors before choosing a response
Not every error deserves the same reaction, and treating them all the same is how teams waste both time and tokens. Retry a permanent error and you're just delaying a failure that was never going to resolve itself. Fail fast on a transient one and you've created a user-facing failure that a few seconds of patience would have avoided.
Retry transient errors such as rate limit 429s and other temporary server-side failures. These come from temporary conditions, and they clear up without anyone touching the code.
Permanent errors should fail immediately, no retry logic attached: bad authentication, malformed requests, content policy violations. Retrying these just burns quota chasing a result that isn't coming.
Then there's the category that's genuinely hard to catch: quality degradation. The HTTP status comes back 200, everything looks fine on the surface, but the output itself is wrong. Hallucinated tool parameters, a response that violates its own schema, a context window that silently overflowed. These need validation gates that check the output before it reaches tool execution, because by the time a downstream system flags the problem, the damage is already done.
The core capacity-engineering patterns: budgeting, backpressure, retries with jitter, circuit breakers, and caching
Budget and backpressure come first. The instinct under load is to retry harder. The actual fix is to send less. Put a concurrency limiter (a semaphore or token bucket) in front of every outbound model call, so the application physically cannot exceed the provider's quota. When the budget fills up, new requests queue. They don't fire off and hope to get lucky on a retry. That one design choice prevents a storm instead of requiring a cleanup afterward. Leave some headroom in the semaphore, too. Whatever quota a team has, its application is rarely the only thing drawing against it.
Exponential backoff with jitter is the right shape for retries. Never retry immediately. If a hundred workers all get rate-limited at once and all retry on the same fixed schedule, they just recreate the same spike a second later, a thundering herd hitting the limit again in perfect sync. A reasonable progression looks like 1, 2, 4, 8 seconds, each with random jitter layered on top to spread retries out across the window. Full jitter goes further: instead of retrying at a fixed exponential delay, pick a random wait time somewhere between zero and the exponential cap. And when the provider sends a Retry-After header, that header is the actual answer. Use it instead of guessing.
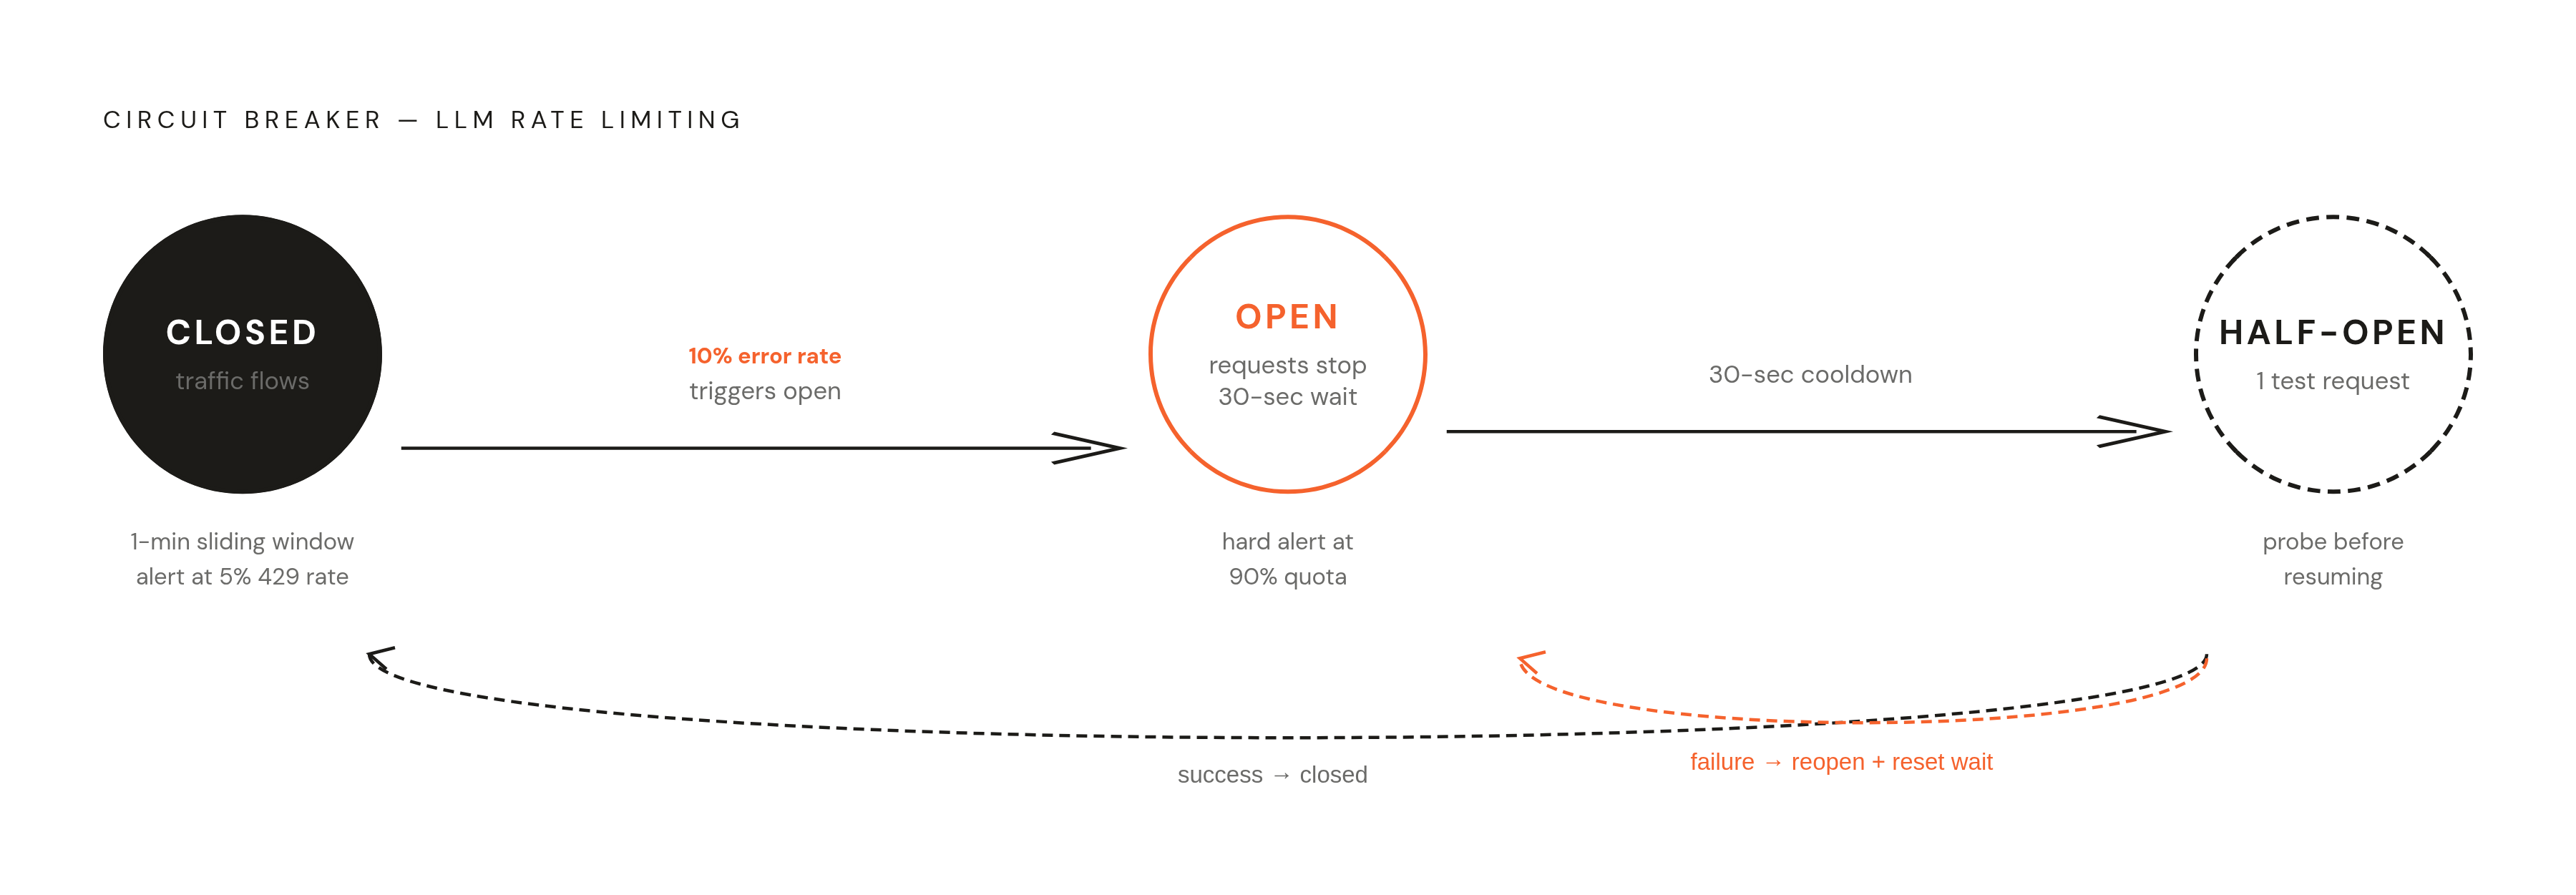
Circuit breakers stop a slow failure from becoming a cascading one. If the error rate crosses 10%, the circuit opens and the app stops sending requests to that endpoint. After 30 seconds, it tries one request in a half-open state. Success closes the circuit and normal traffic resumes; failure reopens it and the wait starts over. This works best measured over a sliding one-minute window rather than a fixed one, since sliding windows catch short bursts that a fixed window would average away and miss. A reasonable SLO target: keep 429 rates under 1%, alert at 5%, and alert again when quota utilization crosses 90%. If average wait time creeps past 2 seconds, that's a signal users are feeling it, and it's time to plan for more capacity rather than tune the retry logic further.
Token compression cuts the problem down at the source. Stripping fields the model doesn't need and flattening nested JSON structures can meaningfully cut token counts per call. One practitioner reported cutting API calls by 67% after restructuring their agent's architecture to eliminate redundant calls. This is upstream capacity engineering. It's upstream capacity engineering, and it makes every other pattern on this list work better, because there's simply less traffic for the budgeting, backoff, and circuit breakers to manage.
Per-app rate limits in multi-integration agents require separate tracking
Every connected app comes with its own ceiling, and those ceilings don't share a queue. Gmail allows roughly 500 requests a day. Slack caps around 60 requests a minute. GitHub is near 60 requests an hour. None of these limits know about each other, and hitting one doesn't pause the others.
An agent running concurrent operations across all three can get rate-limited on Gmail while Slack and GitHub sit wide open, still accepting calls. A single global queue, built on the assumption that "rate limited" means "rate limited everywhere," fails exactly here. It treats three separate ceilings as one, and it either throttles apps that have room to spare or lets a maxed-out app keep taking hits it can't absorb.
The fix is structural: a separate rate tracker per app, not one tracker for the whole agent. Each integration needs its own token bucket, its own backpressure logic, and its own view of how much room is left before the next call.
Fallback routing and the checkpoint-and-escalate pattern for failures that cannot be retried away
Some failures just aren't transient, and no amount of backoff fixes them. A provider degrades for hours. A daily quota runs out and won't refresh until tomorrow. A tool keeps returning data that contradicts itself. Retry logic, no matter how well-tuned, is the wrong tool for all three.
Fallback routing is becoming the default, not the exception. More than 70% of organizations now run three or more models in production, and a model gateway sitting in front of them can route around trouble automatically: if the primary provider is throwing sustained 429s or its quality is slipping, the task shifts to a secondary provider without anyone stepping in. Teams building out these model portfolios increasingly treat inference like a pipeline, with lightweight models handling extraction and tagging while frontier models handle synthesis. That structure means fallback can degrade gracefully to a lighter model instead of failing the task. And whatever happens on the back end, the user should know something happened. Give a partial result where one's possible. Never let a task just quietly vanish.
Checkpoint-and-escalate is the pattern showing up across production systems in 2026. The agent runs on its own under normal conditions, but certain risk signals stop it in its tracks and hand control to a human: a high-value action that can't be undone; the same step failing repeatedly; the model reporting low confidence; or a tool returning data that doesn't add up. Once a person weighs in, execution picks back up from the checkpoint, not from the beginning, which only works if that checkpoint state is saved somewhere durable instead of sitting in memory waiting to disappear. A sensible approval window runs about 7 days for routine operations, tightened to 24 hours for anything sensitive. When the window closes without a response, the task should be cleanly wound down and compensated for, not silently dropped.
The cost of skipping this pattern is visible in real incidents. In July 2025, Replit's coding assistant deleted an entire production database. Around the same time, Washington Post columnist Geoffrey Fowler tested OpenAI's Operator agent and watched it make an unauthorized $31.43 purchase from Instacart. Different products, different companies, same underlying gap: neither agent had an internal checkpoint built to catch a scope violation before it turned into something that couldn't be undone.
Observability as the prerequisite for these patterns working in practice
None of the patterns above mean anything if a team can't see them working. Among practitioners overall, 89% report having some form of observability in place, and that climbs to 94% among teams already running agents in production. Full per-step tracing, the kind that shows every call in a chain rather than just the final result, is used by 62% of practitioners overall and 71.5% of production teams specifically.
Flipped around, the more important number is the gap it leaves. Teams without per-step tracing cannot confirm that a 429 got retried correctly, that the circuit breaker actually opened when it should have, or that a fallback model got invoked. All they can see is that the task failed. Everything upstream of that failure is a black box.
A workable baseline for rate limit observability covers a handful of specific things. Per-call span tracing, capturing HTTP status, latency, model used, token count, and retry attempt number for every single call. Queue depth and semaphore utilization, so a team knows it's approaching capacity before that turns into an outright failure. Per-app quota consumption, tracked separately for Gmail, Slack, GitHub, and every other integration rather than lumped together. Circuit breaker state, logged every time it opens, goes half-open, or closes, along with the error rate that triggered the change. Alerts should fire at a 429 rate above 1% (worth investigating), above 5% (an active incident), quota utilization above 90% (time to plan more capacity), and average wait time above 2 seconds (users are starting to feel it).
Framework adoption for building agents nearly doubled in a year, climbing from a little over 9% of organizations in early 2025 to close to 18% by the start of 2026. That's convenient, but frameworks bring their own tool fan-out and retry paths baked in, code the team didn't write and may not be watching closely. Full telemetry lets a team see what the framework is actually doing underneath the abstraction, instead of taking it on faith.
How the agents people deploy expose you to these limits differently
The rate limit issue doesn't look the same across every agent platform, because each one fans requests out to connected apps in its own way.
OpenClaw is open-source under an MIT license and stewarded by a non-profit foundation. It's GitHub's most-starred software project, with more than 345,000 stars. Structurally, it runs as a Node.js gateway that fans out across messaging channels, including WhatsApp, Telegram, Slack, Discord, iMessage, Signal, Teams, Matrix, and Google Chat, along with more than 20 others, and it ships with a broad set of built-in AgentSkills. A single OpenClaw deployment can be drawing against a dozen different providers' rate limits at once, each with its own ceiling, its own reset window, and its own failure mode when it's exceeded, so per-app tracking is the only thing keeping the whole system from tripping over itself.