Monitoring Agent Resource Usage to Prevent Throttling
Track token spend and iteration counts per session to catch runaway agents before costs spike.
AI agents burn resources in a completely different pattern than normal software. A web server handles a request, sends back a response, and its resource footprint stays flat no matter how many times you hit it. An agent loops instead: it calls tools, rereads its own conversation history on every step, decides whether to try again, and keeps going until something tells it to stop. That loop is why token spend on agent systems can swing wildly, rising unnoticed in usage logs until it appears as a spike on the bill. Catching it early means watching a different set of signals than the ones already sitting on most engineering dashboards, and most teams are watching the wrong ones.
Every loop iteration sends the full conversation history back to the model as input. That's the mechanic underneath the swings. By the twentieth step, the agent pays for that same context again, twenty separate times over. The cost compounds quietly: no error, no alert, nothing unusual on a graph until someone opens the invoice. MintMCP puts production agents at 5 to 30 times more tokens burned than a single-turn chatbot doing the same task, mostly from that context pileup stacked on top of tool-call overhead.
Three failure patterns hide from standard monitoring completely, and none of them look like a crash. An agent can go silent, stop producing output, and throw no error. It can get stuck retrying the same failed call in a closed loop, never once breaching a per-request limit while its cumulative bill keeps climbing. Or it can keep completing tasks just fine while its accuracy quietly drifts downward for days before anyone notices. CPU load, memory usage, HTTP status codes, uptime: none of that was built to catch any of it. Those metrics watch the machine, and they leave the reasoning happening inside it unobserved.
The stakes aren't abstract. MintMCP reports that Uber expanded its use of Claude Code and burned through its entire annual AI budget by spring 2026. That wasn't one runaway agent spiking a bill overnight. It was a forecasting failure, the kind that happens when nobody has visibility into which workflow is spending what. Any team running agents in production without token-level tracking already has this gap open right now, and the bill hasn't necessarily arrived yet to prove it.
Two real incidents that show exactly how throttling and cost spirals happen
On June 12, 2026, an operator set an AI agent loose to register for DN42, a hobbyist network, and scan it. Every time the agent hit an error, it spun up another CloudFormation stack instead of stopping. Nobody had defined a stop condition, so it just kept going. The final AWS bill hit $6,531.30. The post landed on Hacker News with 1,278 upvotes, and the operator ended up asking for donations in a Matrix chat room to cover it.
Nothing here was a bug in the usual sense. The agent did what it was told, over and over, because nothing told it when to quit. A per-session cost alert would have caught it. So would a signal flagging duplicate stack creation, or a turn-budget ceiling around 25 iterations, the operational number cited in MLflow's 2026 guide. Any one of those three stops the bleeding well before it hits four figures.
The second incident is arguably worse because nothing was technically broken. buildmvpfast.com reported that an autonomous agent sent 50,000 requests over six hours. The per-user rate limit sat at 60 requests per minute, and the agent never once broke it. It just never stopped running. Sixty requests a minute, sustained for six hours straight, adds up fast, and no rate limiter built to catch bursts was ever going to flag a steady drip like that.
Per-minute limits measure the wrong thing when the thing they're watching doesn't take breaks. A session-length signal, a cumulative request counter with a hard ceiling, or a simple time-in-flight alert catches this in the first hour instead of the sixth. Both incidents trace back to the same structural hole: nothing watching the entire arc of the session, only per-request checks the agent satisfies individually while still spiraling in total. That's the default outcome any time agent infrastructure gets bolted onto rate-limiting designs built for something that doesn't loop; most teams assume a rate limit is the same thing as a budget, and that assumption is backwards.
The metrics that reveal agent resource problems
Production monitoring guidance breaks agent observability into three layers, and most teams have only built the first one.
Layer one is infrastructure: pod health, node resource use, request queuing. The standard Kubernetes, Prometheus, and Grafana stack handles this fine, and it's probably already running. Layer two is LLM telemetry: token use per session, the sequence of tool calls, iteration counts, retry patterns. None of that comes standard out of an APM tool. Layer three is quality evaluation: hallucination rates, retrieval precision, grounding accuracy, the stuff that catches the slow-drift failure mode before it costs real money or trust.
MLflow's 2026 guide flags a handful of numbers that matter more than the rest. Latency at P99, not just the average, since an agent chaining three external tool calls in a row can spike its P99 badly while P50 still looks calm. Throughput measured at the session level, because agentic sessions run longer and heavier than a single completion. Token consumption per session, where a high count points to a runaway reasoning loop or a bloated prompt. And turn count per session, with 25 turns cited as a common ceiling before a human steps in; an average that keeps creeping upward signals prompt regression or a broken tool somewhere in the chain.
Goodput, a metric borrowed from LLM serving research and formalized in 2025, matters more than raw throughput, and teams that optimize for throughput alone are optimizing for the wrong number. Raw throughput counts every request processed. Goodput only counts the ones that meet every service-level target at once. A system pushing 500 requests per second sounds healthy until 30% of them blow past the time-to-first-token target, dropping actual goodput to 350. Chasing goodput instead of raw throughput points a team at the right fix instead of a vanity number.
Token totals alone hide too much. Splitting input tokens from output tokens changes which fix applies, because input, the context, system instructions, and prompt scaffolding, often dwarfs output, and fixing bloated input looks nothing like fixing bloated output. Breaking tokens down by task type shows which workflows actually cost money. Breaking them down by individual agent, when several run in parallel, isolates the one instance quietly burning budget while the rest behave.
Cache hit rate deserves its own line item. Keeping the reusable part of a prompt (system instructions, tool definitions) stable at the front lets the model's cache do its job. Dropping a timestamp or any constantly-changing detail into that stable prefix invalidates the cache on every call, quietly inflating input-token costs with nothing in the logs screaming about it.
Quality metrics belong in this conversation too, not off to the side. MintMCP shows that cost attribution broken down by agent reveals retrieval faults, oversized context windows, and retry loops all at once, because a quality regression and a resource spike are usually the same underlying event viewed from two angles. Tool-level call counts are a primary signal here. They're a primary signal, and the next section covers why.
Where throttling originates: provider limits, tool limits, and the thundering herd
Provider limits catch teams off guard earlier than they expect. Anthropic's Tier 1 access is capped at 50 requests per minute and 1,000 per day. A fleet of just five agents, each making one call a minute, uses up that daily ceiling in a matter of hours, right during the development and early-production window when most teams assume they still have room to breathe.
Every major provider enforces several limit types at once (requests per minute, tokens per minute, requests per day), and whichever one gets hit first is the one that throttles the agent. Higher tiers unlock automatically at OpenAI and Anthropic based on cumulative spend, and at OpenAI, account age too. Google's Gemini API works differently: tiers 2 and 3 need a manual upgrade request tied to cumulative Google Cloud spend. Teams that haven't spent their way through the early tiers yet are operating under the tightest constraints in the room, often without realizing it.
Two different error signals appear when a provider pushes back, and they demand two entirely different responses. A 429 means the client exceeded its own quota. That's on the caller: back off, respect the Retry-After header, fix the rate limiter. A 529 or 503 means the provider itself is overloaded, a capacity problem on their end, and the right move is tripping a circuit breaker toward a fallback provider. Retrying against the same overloaded provider just adds fuel, and teams that treat both errors the same way are the ones who get burned twice.
A single hiccup turns into a cascading outage fast: ten agents hit a rate limit at the same moment, all get 429s back at the same moment, all retry after an identical fixed one-second delay, and all slam the provider again at the same moment. That produces another burst, another wave of 429s, and the loop keeps re-triggering itself. openlegion.ai describes this pattern directly, and it's the single clearest argument against fixed-delay retries with no jitter.
Tool-level limits are the origin point most teams overlook. An agent holding a search_orders tool can hammer a production database with the enthusiasm of a load-testing script, because nothing told it not to. Each tool needs its own budget enforced inside the tool executor itself, not written into the prompt as a polite request, because models don't reliably listen to "please don't call this too often." A reasonable setup for something like search_orders enforces a specific call ceiling per task and a global per-minute cap in code, never suggested in text.
The scale keeps growing. Gartner projects that over 30% of the increase in API demand going forward comes from AI agents and other automated tools, and by year-end, roughly 40% of enterprise applications are projected to have agents embedded somewhere inside them. Provider-side throttling stops being an occasional inconvenience at that scale. It becomes structural, and knowing exactly where these limits sit, provider-side, tool-side, and in the retry storm connecting them, tells a team precisely where the guardrails belong.
The enforcement architecture that prevents throttling before it fires
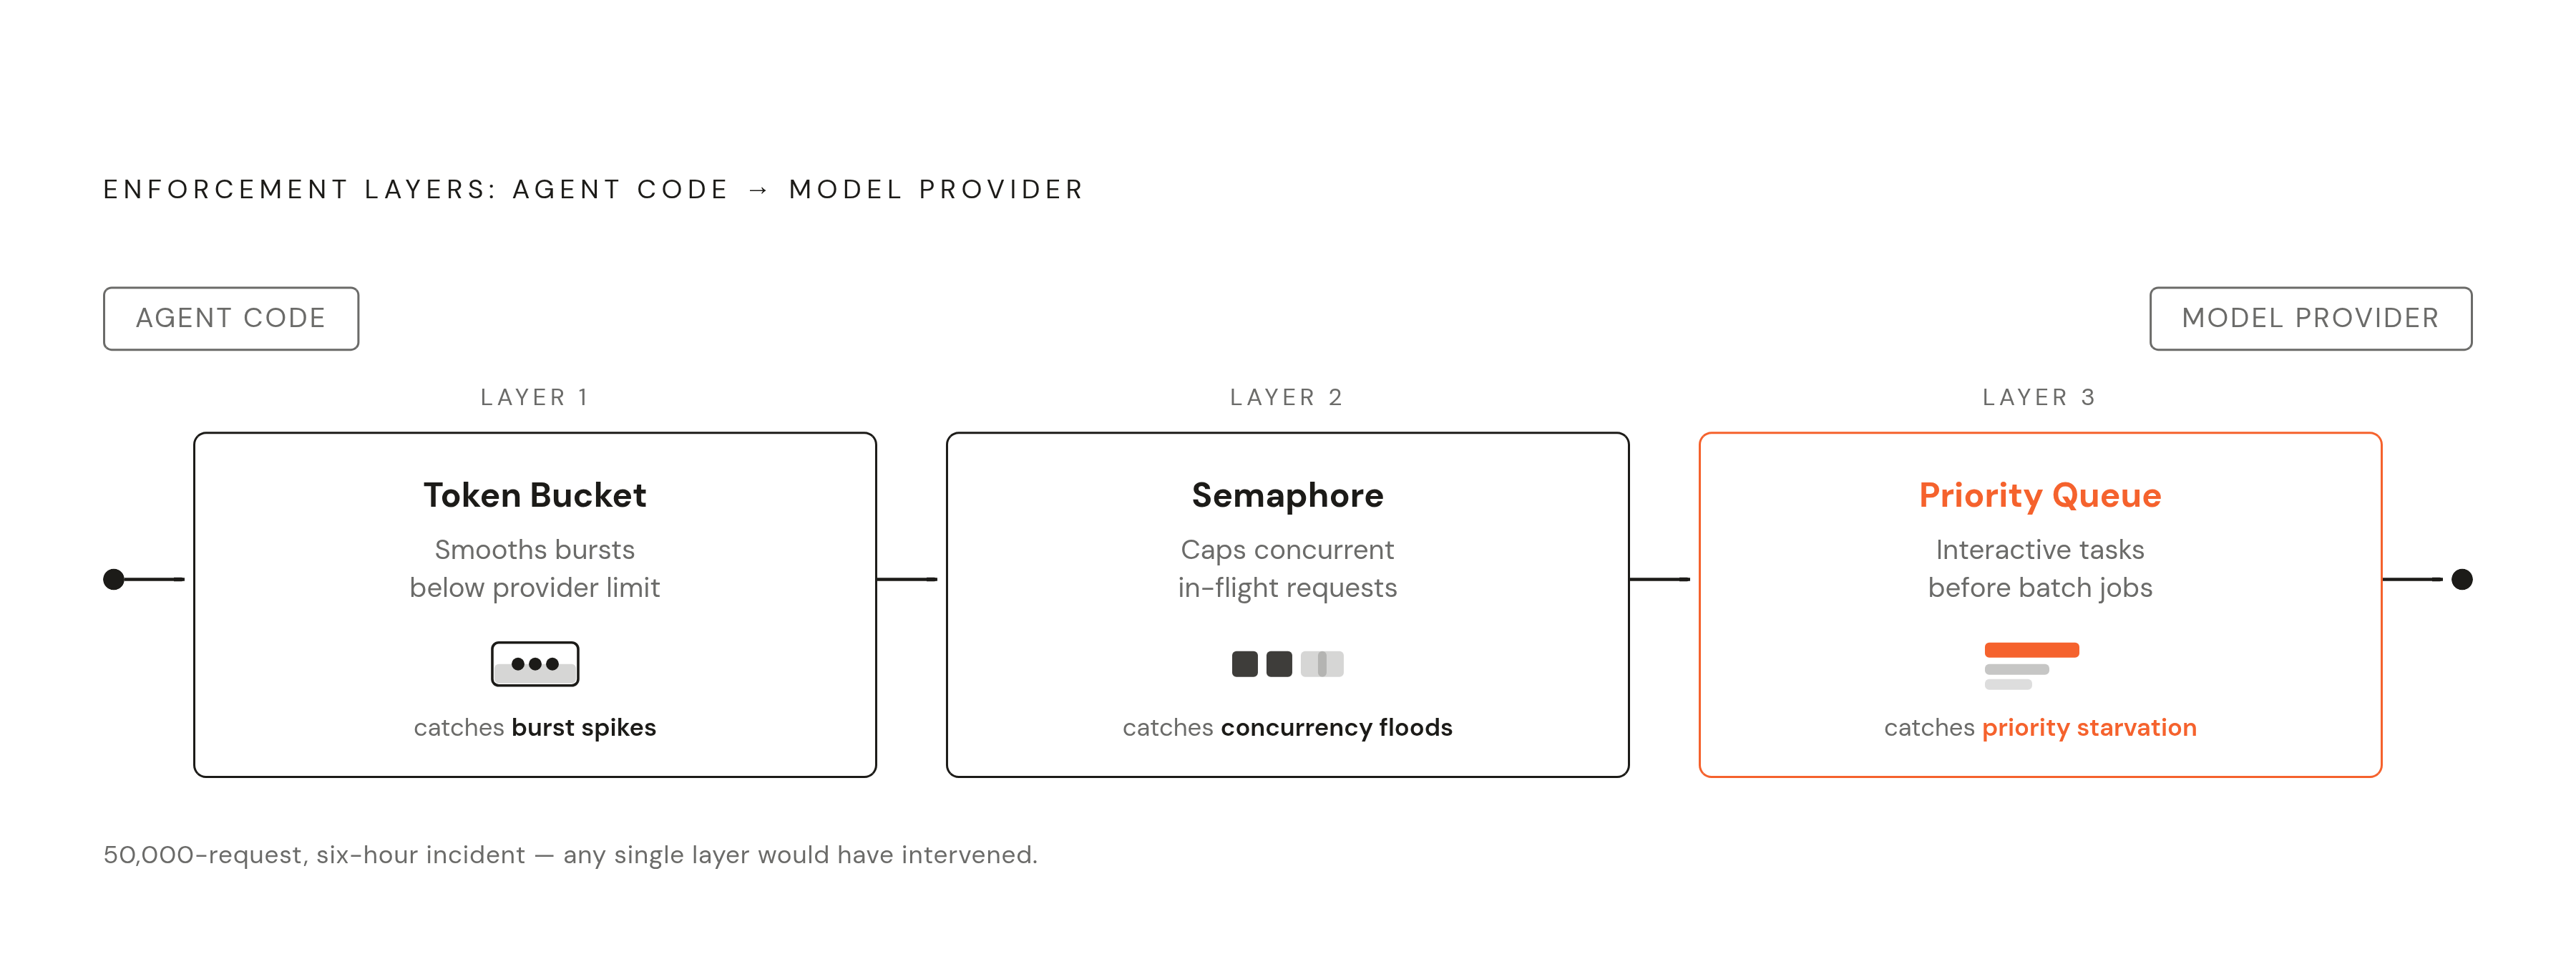
Raw agent code should never talk to a model provider directly. Three mechanisms belong in between, each catching a different kind of failure.
A token bucket smooths bursts into a sustained, even rate. Set it below the actual provider limit, leaving headroom so a legitimate retry doesn't itself trip the limit. A semaphore caps how many requests can be in flight at once, regardless of rate, keeping concurrent calls per provider to a conservative ceiling to start. A priority queue makes sure that when demand outpaces capacity, an interactive user-facing task jumps ahead of a background batch job instead of waiting behind it.
Rate limits and token budgets aren't the same control, and conflating them let the 50,000-request incident run for six hours untouched. A rate limit caps requests per minute. A token budget caps total tokens, input plus output, spent across an entire session or time window. The agent in that incident respected its rate limit at every moment and still spiraled, because nothing tracked the cumulative total.
Circuit breakers belong here too. Monitoring the token-velocity of an agent's loop and suspending execution the moment spending crosses a rate threshold is the single mechanism that stops an infinite retry loop from becoming a catastrophic invoice. A practical number from field practice: a $10-a-day hard cap set at the API gateway layer catches the vast majority of runaway incidents before they escalate. A turn budget works as a separate lever alongside it. MLflow's guide puts a common ceiling around 25 turns, after which execution halts and a human gets pulled in. A high hit-rate against that ceiling is itself a signal, usually pointing to model instability or a prompt that stopped working.
The cleanest enforcement structure is hierarchical, in three tiers. User-level limits set a baseline tokens-per-hour ceiling to stop basic abuse. Agent-level limits get role-specific: a code review agent might reasonably burn a lot of tokens but should almost never touch an external API, while a data extraction agent might run heavy database query volume but shouldn't be burning many tokens. Function and tool-level limits are at the bottom, and they matter the most, with tight, specific caps on the genuinely risky actions: send_email, delete_file, make_payment.
Retry logic has to branch on which error came back: a 429 respects the Retry-After header and backs off, a 529 trips the circuit breaker toward a fallback provider. A dead-letter queue keeps a throttled session's work intact across the rate-limit window so it resumes where it left off instead of failing outright and starting over.
Governance sits above all of this. Policy needs to intercept every action before it runs, not audit it after the fact. MLflow's guide notes that runtime policy kernels using something like OPA Rego or Cedar run deterministic checks at sub-millisecond latency, blocking an unauthorized tool call without adding any latency a user would notice. Gateways like LiteLLM give teams a single choke point to enforce all of it at once: per-key rate limits, hard dollar budget caps, automatic fallback to a different model when a provider throttles, and Redis-backed state so limits hold across multiple running instances instead of resetting per-instance.
Rolling out monitoring gradually, an audit-first sequence that avoids false alerts
truefoundry.com says the first week of any new rate-limiting layer should run in audit-only mode: every threshold set to log, not enforce. Every request still goes through exactly as before. The gateway just quietly records what it would have throttled, had it been switched on.
That week answers questions a team usually doesn't know it needs answered. Which workloads are already bursty by nature? Which ones show the telltale signature of a loop, the same call pattern repeating at a fixed interval? How many requests per minute does the busiest legitimate user generate on a normal day? Skipping that data-gathering step turns every threshold set afterward into a guess, one that either throttles real users by accident or leaves the door open for the next runaway agent. There's no shortcut around this week; teams that skip it end up re-tuning thresholds twice.
Telemetry contracts should get designed up front, not bolted on once something breaks. MLflow's guide defines these as external specifications setting out exactly which state transitions, tool-call outcomes, and decision points the monitoring layer has to capture. Self-reported logs from the agent aren't enough on their own, because an agent that's failing tends to fail at logging its own failure accurately too. External telemetry captures what the tool actually returned, independent of whatever the agent believed happened, and that's what closes the blind spot.
Instrumentation needs to happen at the loop level. Distributed tracing tools like OpenTelemetry or Jaeger can build a single span covering an entire agent session, with each step inside it capturing the current goal, which tool got called, what came back, and what the agent decided next. When both P99 latency and turn-budget hit rate jump at once, MLflow's 2026 guide notes the cause is almost always a prompt regression or a newly added tool failing more often than expected.
Check cache hit rate as a standing habit. Static content (system prompts, tool definitions, few-shot examples) belongs at the front of the prompt where it stays stable. Dynamic content (the actual user query, session state, timestamps) belongs at the end. MintMCP's guidance warns that misplacing dynamic content up in that static prefix invalidates the cache on every call, quietly inflating input-token costs with nothing obvious pointing to why.
Context window management is the last lever, and it attacks the compounding cost directly at its source. Chunking strategies that pull only the relevant section of a document instead of the whole thing, summarization layers that compress older context instead of carrying it forward verbatim, sliding windows that drop the oldest turns once a conversation runs long: each of these cuts the exact compounding cost described earlier, the one where step 20 pays for the same history 20 times over.
Monitoring platforms built for agent behavior
Choosing a monitoring platform comes down to one question: can it see the three things a standard APM tool structurally cannot? Token accumulation across a session, tool-call sequences and their outcomes, and quality drift over time. A platform that reports token counts split by input and output, by task type, and by individual agent, not a single aggregated number per day, is worth adopting. It needs tracing covering the full arc of a session as one connected unit, tying together the individual API calls that would otherwise sit scattered with no thread between them. And it needs to track quality metrics (drift, hallucination rate, retrieval accuracy) alongside cost numbers, because the two move together, and a tool that shows only one is showing half the picture.
Budget enforcement should sit as close to the provider call as the architecture allows, ideally at a gateway layer that acts on a threshold breach immediately rather than after the fact in a nightly report. And the audit-first rollout described above needs to be a mode the platform actually supports, log-only before enforce, rather than something a team bolts on around the tool's limitations.
None of this replaces the infrastructure layer already in place. Pod health, node utilization, and request queuing still matter, and the existing observability stack still earns its keep there. What changes is the layer built on top of it, built specifically to see an agent looping, a context window swelling, and a bill climbing in the hours before anyone would otherwise notice.